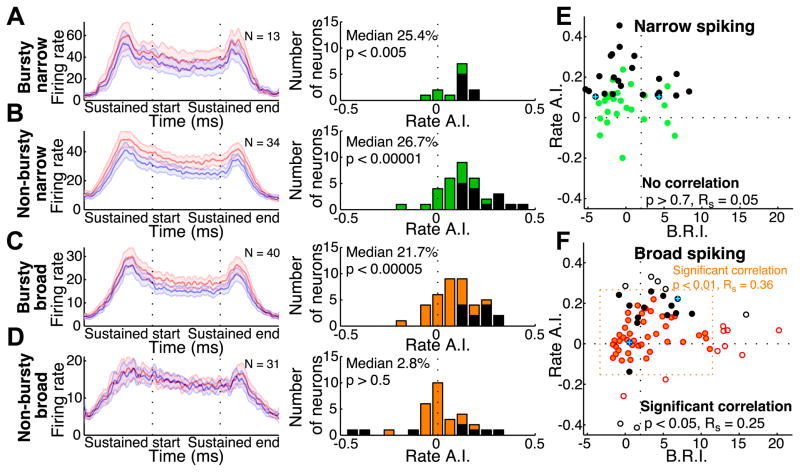
Figure 4.
Relationship between burstiness/refractoriness index and attention-dependent rate modulation. A–D: Attention-dependent modulation of firing rate across four groups of V4 neurons: bursty narrow (A), non-bursty narrow (B), bursty broad (C), and non-bursty broad (D). Left panels show population mean stimulus-evoked responses for tracked (red traces) or ignored (blue traces) stimuli (data smoothed with a Gaussian filter where σ = 25ms; shaded regions indicate +/− 1 SEM). The middle column of panels shows the distributions of the firing rate attention index for each population, with individually significant units (p < 0.001) shaded black. E–F: Population scatter plots of burstiness/refractoriness index (B.R.I.) vs. firing rate attention index (rate A.I.). Narrow spiking cells are shown in panel E (green circles), broad spiking cells in panel F (orange circles). Individual units with significant attention-dependent rate modulation (p < 0.001) are shown in black. Points with blue crosses correspond to the example individual neurons in Figures 2 and 3. In Figure F, filled circles indicate broad-spiking neurons with rate A.I. and B.R.I. values within 1.5 STD of the broad-spiking population mean (indicated by dashed orange box). There is a significant correlation between B.R.I. and rate A.I. across the entire broad spiking population (open and filled circles, Spearman’s correlation, p < 0.05, Rs = 0.2499), and for the subset within 1.5 STD of the mean (filled circles, Spearman’s correlation, p < 0.01, Rs = 0.3583).

