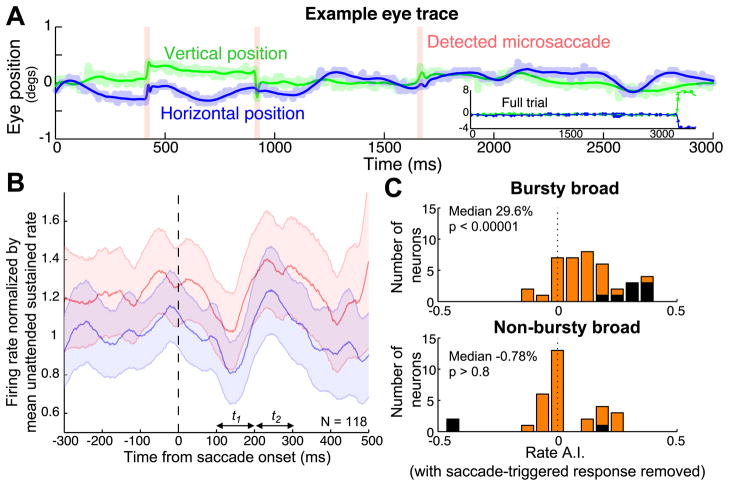
Figure 5.
Microsaccade-triggered response modulation. A: Single trial example of the saccade detection algorithm (see Methods). Blue and green curves correspond to the model fits of the horizontal and vertical eye position, with shaded lines indicating the raw position traces. Detected microsaccades are indicated by pink vertical bars. Inset shows eye position across the entire trial (including the saccade to the cued stimulus at the end of the trial). B: Microsaccade-triggered responses averaged across the entire population. Curves show the population mean of normalized microsaccade-triggered responses to when the stimulus was tracked (red traces) or ignored (blue). Data are smoothed with a Gaussian filter where σ = 25ms; Shaded regions indicate +/− 1 SEM). C: Distribution of the firing rate attention index for the bursty and non-bursty broad spiking groups, calculated after removing all action potentials that occurred within 400 ms after a detected microsaccade. Individually significant units (p < 0.001) are shaded black.

