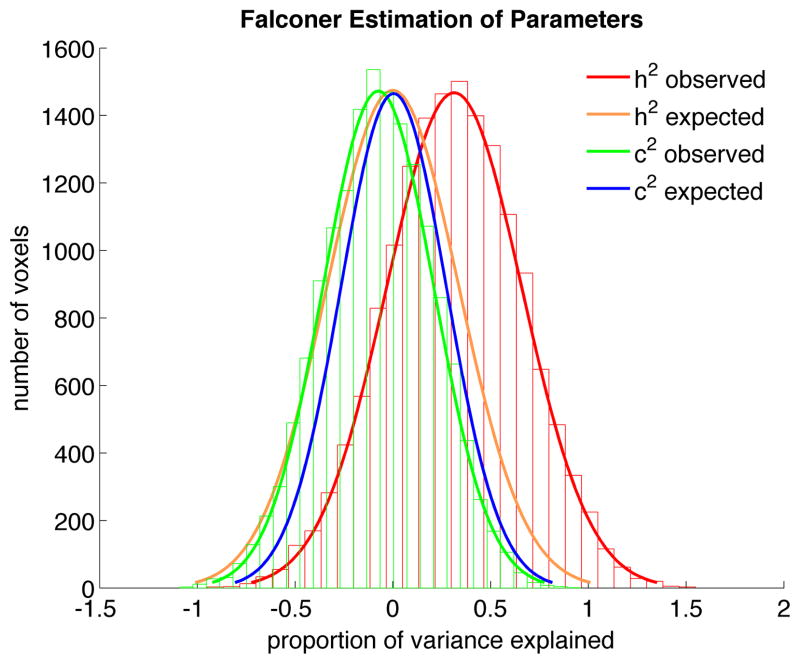
Figure 1. Observed and expected sampling distributions for genetic and environmental parameters.
h2 observed = [2*(rMZ − rDZ)] and c2 observed = [(2*rDZ) − rMZ] (Falconer and Mackay, 1996). h2 and c2 expected are normal distributions with a mean of zero and an expected sampling variance estimated as [4*((1 − rMZ2)2/m + (1 − rDZ2)2/n)] for h2 expected, and [(4*(1 − rDZ2)2 )/n + ((1 − rMZ2)2/m)] for c2 expected, where n and m refer to the numbers of DZ and MZ twin pairs, respectively, and rMZ and rDZ are set to zero under the null hypothesis of no heritability and no common environmental influence (Visscher, 2004).

