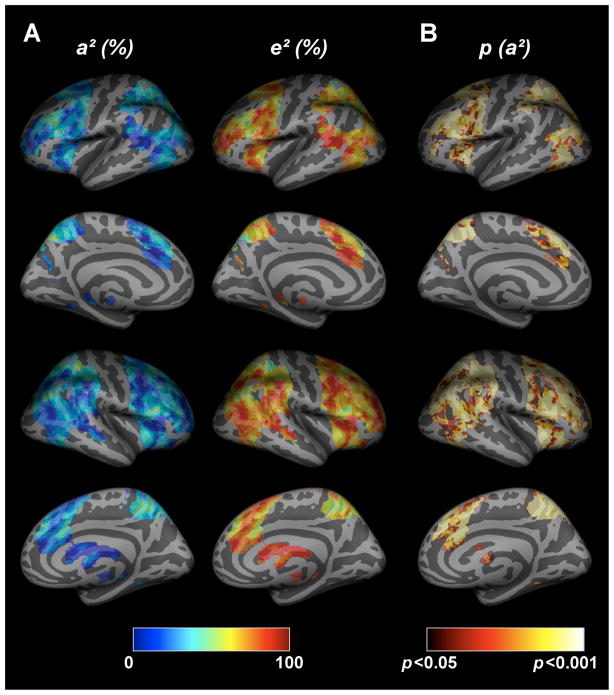
Figure 3. Variance component estimates for n-back task-related brain activation.
(A) Percentages of variance explained by genetic (a2) and unique environmental factors (e2). (B) Probability map for a2, indicating which genetic estimates were significant after height- (p < 0.05) and cluster- (> 147 voxels) thresholding.

