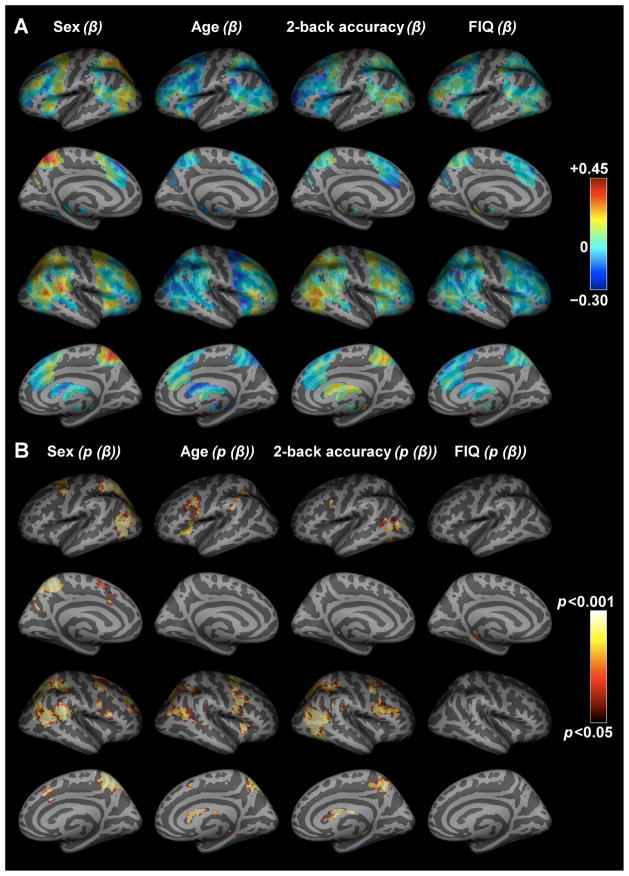
Figure 4. Covariate effect estimates for sex, age, 2-back performance accuracy, and FIQ.
(A) Standardized regression coefficients (beta values) obtained from multiple regression of task-related activation on sex, age, 2-back performance accuracy, and FIQ in Mx (Neale et al., 2002). Positive effects, i.e. greater activation in males, in older participants, in participants who performed better on the n-back task, or with higher FIQ, are represented by hot colors and negative effects, i.e. greater activation in females, in younger participants, in participants who performed worse on the n-back task, or with lower FIQ, are represented by cold colors. (B) Height- (p < 0.05) and cluster- (> 147 voxels) thresholded p-value maps corresponding to the regression coefficient maps of sex, age, 2-back performance accuracy, and FIQ.

