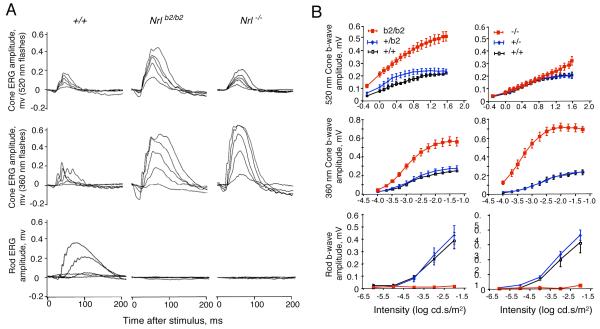
Figure 5. Distinct cone and rod functional responses in Nrl+/b2, Nrlb2/b2 and Nrl−/− mice.
A, Representative electroretinogram traces for Nrlb2/b2 and Nrl−/− mice at around 8 weeks of age. Upper two rows, photopic cone responses to stimuli with wavelengths of 520 nm and 360 nm that optimally activate mouse M and S opsins, respectively. Lower row, scotopic rod responses. Enhanced M and S cone responses were detected in Nrlb2/b2 mice but only enhanced S cone responses in Nrl−/− mice. Families of traces are shown for light intensities of 0.5, 1.26, 2, 3.16 and 7.94 cd.s/m2 at 520 nm and 0.0001, 0.00032, 0.001, 0.0032 and 0.0316 cd.s/m2 at 360 nm for cones and 1×10⁻⁶, ×10−5, 10×−4, 10×−3 and 10×−2 cd.s/m2 for rods.
B, Intensity-response curves of average ERG responses for groups of 4 - 6 mice (means ± sem). Cone (top two rows) and rod (bottom row) ERG responses to varying stimulus intensities were determined for +/+, Nrl+/b2 and Nrlb2/b2 mice and separately, for +/+, Nrl+/− and Nrl−/− mice. Nrlb2/b2 and Nrl−/− mice were each compared with their own +/+ and heterozygous groups on comparable genetic backgrounds.

