
Figure 1.
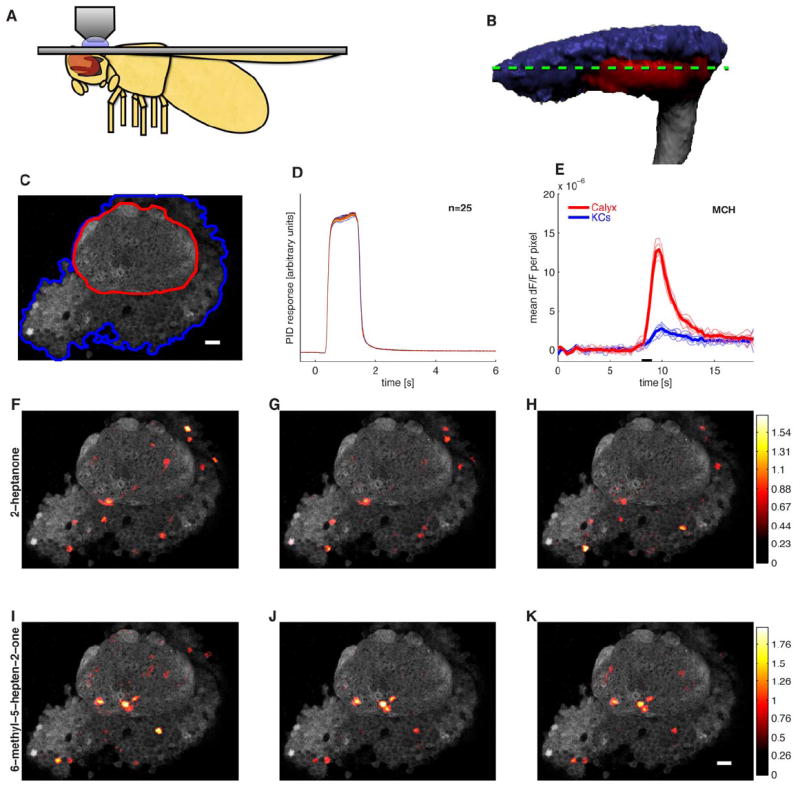
Odors evoke consistent patterns of calcium activity in the mushroom body. A. Schematic of a fly in the recording platform. Mushroom body is shown in dark gray behind the fly’s eye. B. Three dimensional reconstruction of the mushroom body (MB) obtained using the OK107-Gal4 driver. The Kenyon cell (KC) somatic region is shown in blue, the input neuropil region (calyx) in red, and axonal outputs in gray. The green dashed line indicates a typical imaging plane. C. Optical section through the MB showing the clearly distinguishable KC somatic region (blue) and dendrites in the calyx (red). Image is obtained by averaging 12 frames of basal GCaMP3 fluorescence. D. Timecourses of 25 pulses of isoamyl acetate measured using a photo-ionization detector (PID; arbitrary units) showing the high reliability of odor delivery. Odor delivery valve opens at t = 0 s and closes at t = 1 s. PID data are smoothed with a 0.1s boxcar filter. E. Mean change in fluorescence per pixel following presentation of 4-methylcyclohexanol (black bar) in the calyx (red) and KC region (blue) from the optical section shown in C. Thin lines show 5 individual odor presentation trials and thicker lines the means. The dF/F values are low because most pixels do not change in intensity. F-K. Basal fluorescence (gray) and mean evoked dF/F (heat map) from the experiment shown in C. Mean dF/F is calculated over 0.5 to 4.5 s following stimulus onset. Each row shows responses to three different presentations of the same odor. Responses are evident both in the dendritic region in the calyx (red outline in C) and the cell body area (blue outline in C). The pattern of responding neurons is similar within an odor and different across odors. Scale bars indicate 10 μm.