
Figure 3.
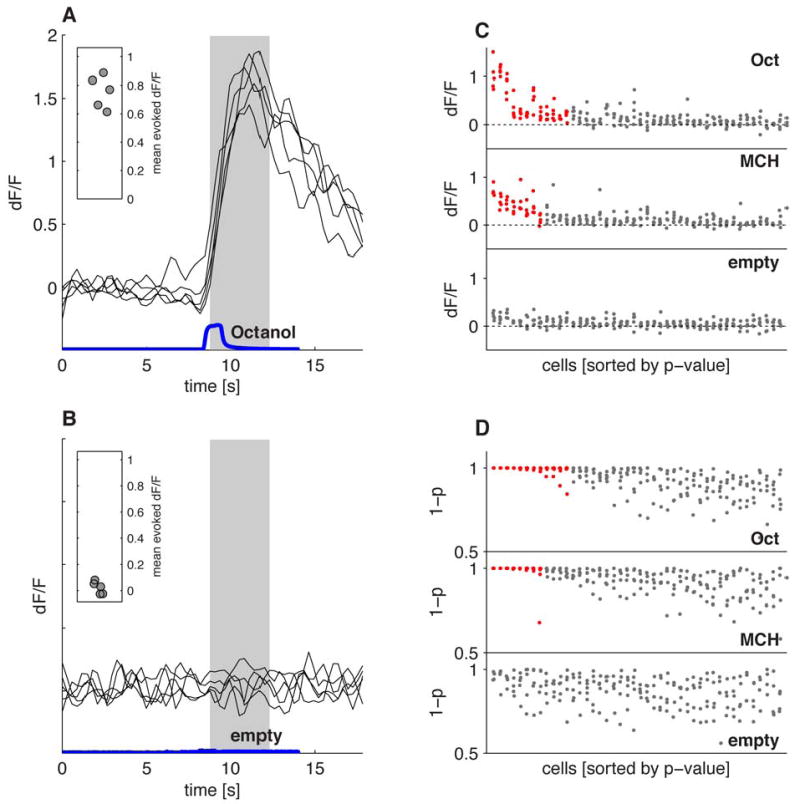
Reliably identifying KC odor responses. A. Responses of a single KC to 5 presentations of 3-octanol (black traces). The blue trace shows the kinetics of the odor pulse measured by PID. Response amplitudes (inset) are calculated by averaging activity between 0.5 and 4.5 seconds following stimulus onset (shaded gray region). B. Responses of the same cell to the clean air control. C. Response amplitudes of the 45 strongest responding neurons from a single optical section to 3-octanol (Oct), 4-methylcyclohexanol (MCH), and clean air. Each data point is the evoked response amplitude from a single cell on a single trial. A cell is deemed responsive to the odor if it responded significantly (p < 0.01) on more than half of trials. Responsive cells are indicated by the red points, non-responsive cells in gray. Cells are sorted independently for each stimulus according to the mean p-value. D. Statistical significance of response peaks from the neurons shown in C. The y-axis shows 1 minus the p-value. Cells are sorted as in C. Note that responsive cells consistently have values close to 1 on almost all trials; this is not the case for cells classified as non-responsive.