
Figure 5.
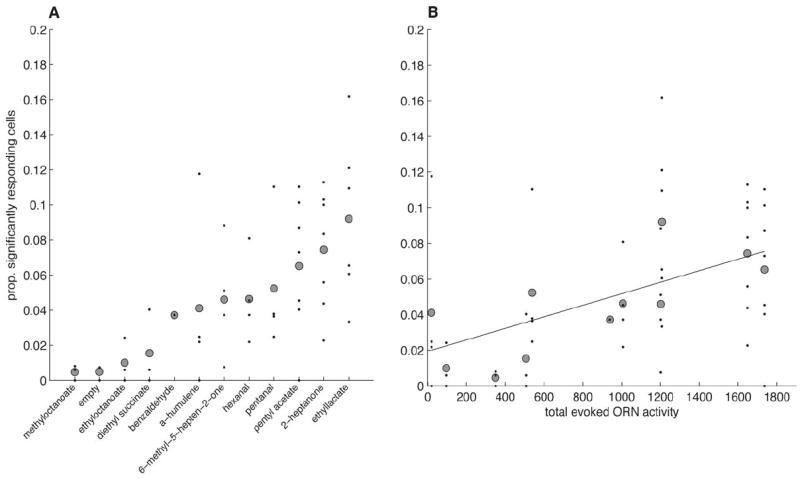
Responses to monomolecular odors are sparse in MB. A. Proportion of KCs responding to a variety of different odors. Black points show sparseness values from individual animals (n=8 flies), gray circles show the grand mean. B. Mean sparseness values as a function of total ORN activity (ORN data from (Hallem and Carlson, 2006)) for each odor. Some KC responses shown in A are not plotted since ORN data do not exist for these odors. The slope of the fit is significantly different from zero (p = 0.0001, see Results).