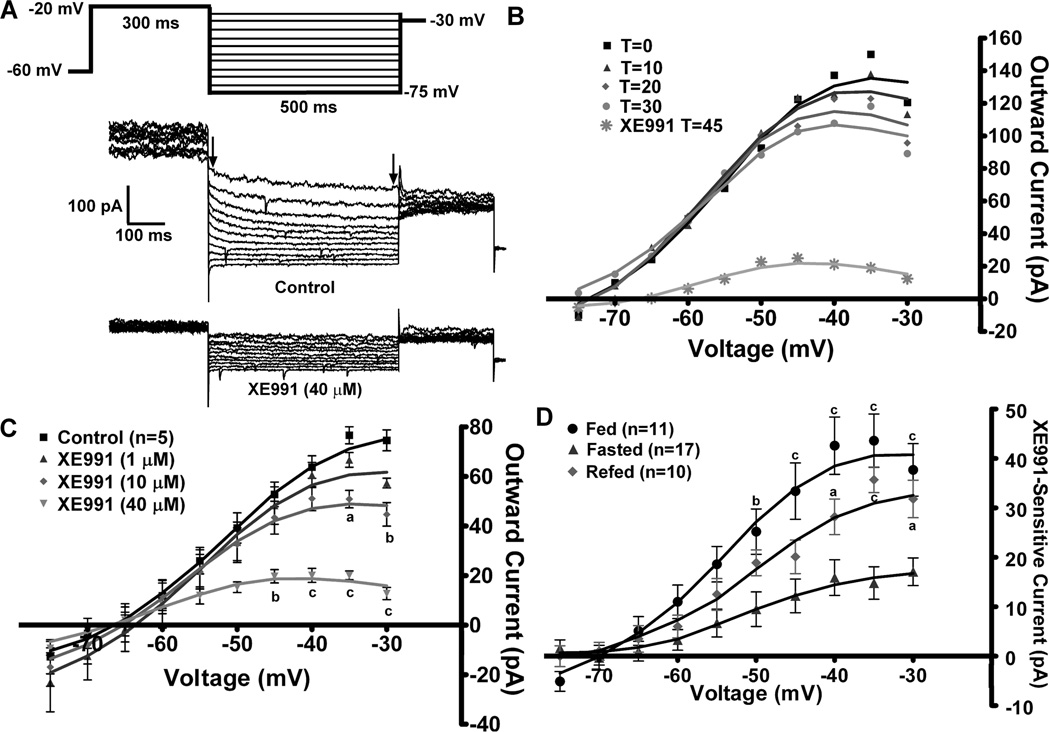
Figure 2. Fasting reduces the activity of the M-current in NPY neurons.
A, The slow deactivation of the M-current (IM) in NPY neurons was recorded from fed, male mice using whole-cell patch clamp recording. From a holding potential of −60 mV, a voltage jump to −20 mV (300 ms) was followed by steps from −25 to −75 mV in 5 mV increments (500 ms). Currents were recorded under control conditions and after 10 min incubation with XE991 (40 µM), a selective KCNQ blocker in the presence of TTX (1 µM), The XE991-sensitive current was calculated by subtracting the current relaxation (the difference between the instantaneous and steady state (arrows)) in XE991-treated traces from the control traces. This XE991-sensitive current is graphed as an I–V plot (see Figure 2D) (Xu et al., 2008). B, The K+ currents evoked by the deactivation protocol do not rundown over the 30 min recording period. T=0 is 3 minutes after whole-cell access. XE991 (40 µM) was perfused after 30 min to demonstrate the amount of M-current still active. The figure is from one cell, but rundown was examined in 2 other cells with the same results. C, To determine the most effective dose to measure the M-current across treatments, a sequential concentration response of XE991 (1, 10, 40 µM) was applied to same neuron (n=5). I–V plots were analyzed by a two-way ANOVA (p<0.05, F=4.67, df=3) followed by Bonferroni-Dunn comparison. a, p<0.05; b, p<0.01; c, p<0.001 compared to control. D, In NPY neurons, the I–V plot of A from fed males (n=11); fasted males (n=17) and 24 hr re-fed males (n=10). I–V plots were analyzed by a two-way ANOVA (p<0.01, F=7.3, df=2) followed by Bonferroni-Dunn comparison. a, p<0.05; c, p<0.001 compared to fasted.

