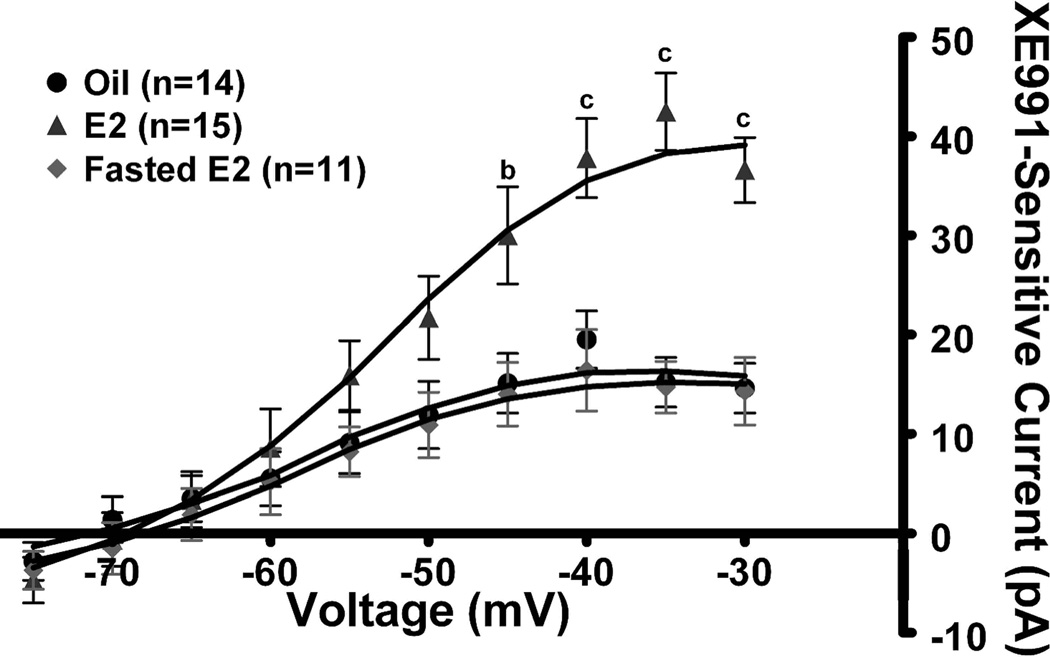
Figure 4. 17β-estradiol increases the activity of the M-current in NPY neurons.
A, Using the same protocol described in Figure 2, the I–V curve in the E2-treated females (n=15), the oil-treated females (n=14) and 24 hr fasted females (n=11). I–V plots were analyzed by a two-way ANOVA (p<0.01, F=6.0, df=2) followed by Bonferroni-Dunn comparison. a, p<0.05; b, p<0.01; c, p<0.001 compared to oil-treated and fasted E2-treated.

