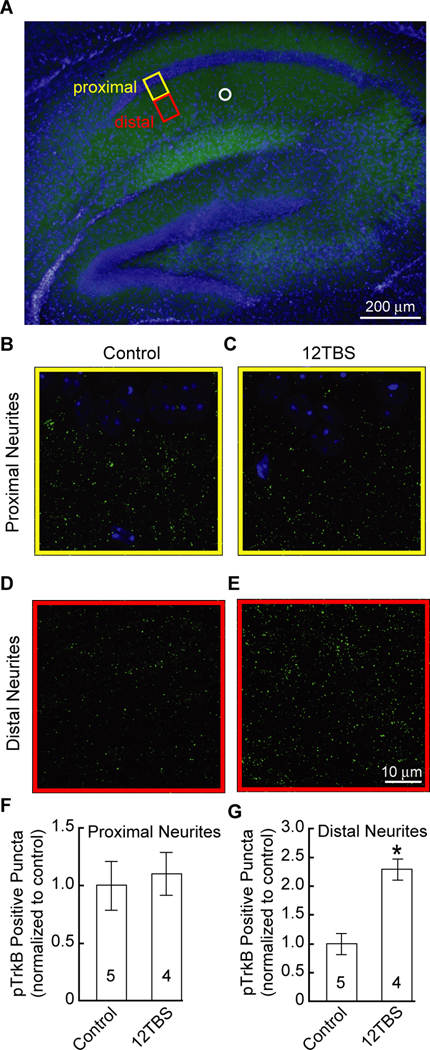
Figure 3. TrkB activation induced by 12TBS in CA1 dendritic area of hippocampal slice.
(A) Double staining of pTrkBY816 (green) and DAPI (blue) of hippocampus slice. The proximal and distal areas of hippocampal CA1 neurons are highlighted by the yellow and red boxes, respectively. The position of the stimulating electrode is indicated by the white circle.
(B–C) Double staining of pTrkBY816 (green) and DAPI (blue) of proximal region from cell body with or without 12TBS. Note the CA1 neuronal cell body stained by DAPI located in the upper part of the images.
(D–E) Double staining of pTrkBY816 and DAPI of distal region from cell body with or without 12TBS. Note the marked increase in pTrkB staining after 12TBS.
(F–G) Quantification of the number of pTrkB positive puncta in the proximal and distal regions from cell body of CA1 neurons, respectively (* P<0.001, t-test).

