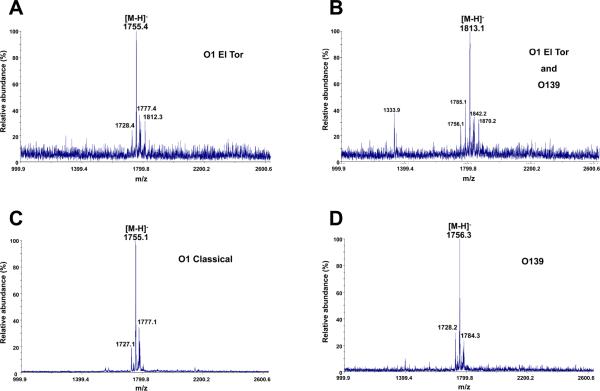
Figure 2. MALDI-TOF mass spectrometry of V. cholerae serogroups O1 and O139.
Lipid A species of V. cholerae O1 El Tor, O1 classical and O139 were isolated and fractionated by DEAE-cellulose chromatography using published protocols (Zhou et al., 1999). V. cholerae O1 El Tor strains produced lipid A species giving predominant peaks at m/z 1755.4 and m/z 1813.1, panels A and B, respectively. V. cholerae O139 showed similar results (panel D plus a spectrum similar to the one in panel B). However, the V. cholerae O1 classical strain only produced a predominant peak at m/z 1755.1 (panel C). Although mass spectrometry data was acquired on lipids eluting in all salt fractions from DEAE columns, only the most representative data are shown. Data shown in panels A, C, and D are from lipids eluting in the 240 mM fraction; however, lipids eluting in the 120 mM fraction are shown in panel B. The minor peaks at m/z 1728.4, m/z 1785.1, m/z 1727.1 and m/z 1728.2 arise from a lipid A with an acyl chain reduced by two carbons in length compared to the major ion. The peaks at m/z 1813.1 and m/z 1812.3 might arise from a lipid A species with extended acyl chains (by 4 carbons). The minor peaks at m/z 1842.2 and m/z 1784.3 arise from lipid A species with an acyl chain addition of two carbons in length compared to the major ion. Minor peaks at 1777.4 (panel A) and 1777.1 (panel C) m/z represent sodium adducts of the major parent ion.

