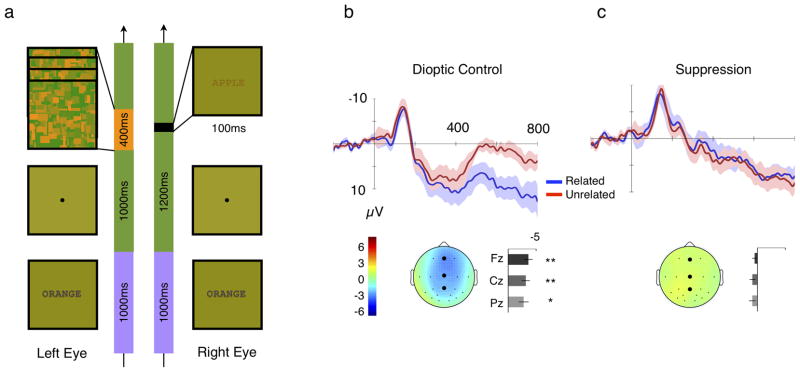
Figure 1.
The stimuli and results of Experiment 1. a) Illustration of stimulus sequence of Experiment 1 (related-pair type of a suppression trial). Context word (ORANGE) is presented to the two eyes for one second and the first Mondrian frame is presented to one eye after the 1 second fixation. Four Mondrian frames are presented in sequence, one every 100 msec. The target word (APPLE) is presented the other eye for 100 msec with the third Mondrian frame. b)–c) Results of Experiment 1 (N=6). Event-related potential (ERP) waveforms and the N400 amplitude obtained from b) dioptic-control and c) suppression trials. ERP waveforms elicited by the related targets are drawn in blue and by the unrelated targets are drawn in red. The shaded regions of matching color indicate the ±1 S.E. between subjects. The lower panel of each figure shows the N400 amplitude measured for all electrodes represented by topographical map and the N400 amplitude of the three key electrodes (Fz, Cz and Pz) are plotted at the right side of the topographical map. The N400 amplitude was obtained from the difference waves (unrelated pairs–related pairs) during the temporal window of 350–500 msec after the onset of the target word. The N400 amplitudes of the topograhical map are color coded as shown with the color bar of Figure 1b and t-test significance is indicated by the significance marker (* for p<0.05 and ** for p<0.01) for the N400 amplitudes of the three key electrodes.

