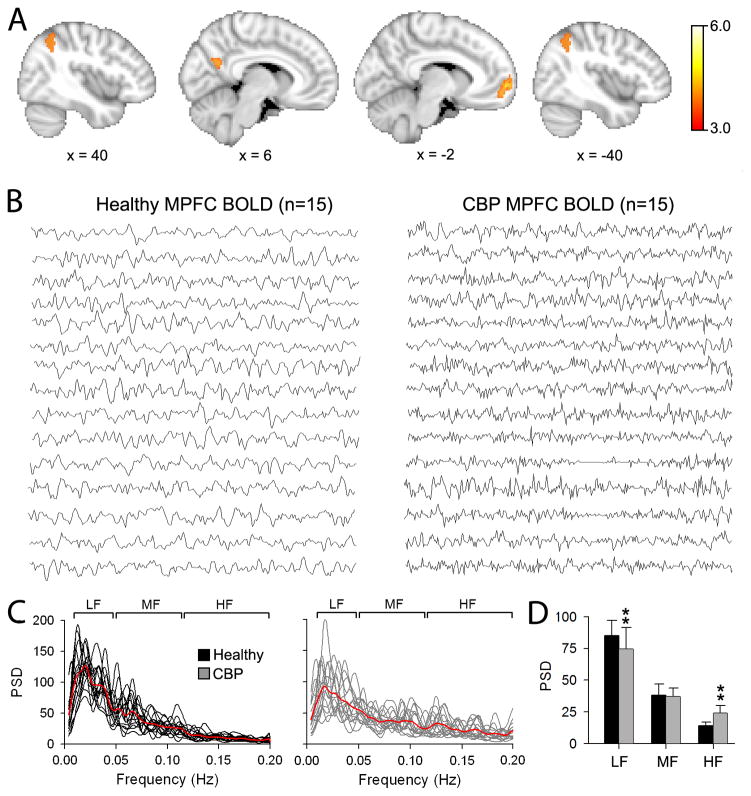
Figure 2. Regional differences in power spectral density between Healthy and CBP during resting state fMRI.
(A) Whole brain voxel-wise differences in power for the high frequency band between CBP and healthy. Brain areas in red-yellow depict statistically significantly higher power in CBP compared to controls (unpaired t-test, random-effects model, z-score>3.0, cluster p < 0.01, corrected for multiple comparisons), localized mainly to the medial prefrontal cortex (mPFC), posterior cingulate (PCC) and bilateral parietal cortices (LP). No significant differences were detected for the mid and low frequency bands. Brain images in standard MNI space, coordinates in mm. (B) Individual BOLD time courses from the mPFC for healthy (left) and CBP (right). (C) Individual power spectra for the mPFC BOLD time courses superimposed separately for Healthy (black traces) and CBP (gray traces). Red traces represent group averages. (D) Bar graphs show the mean ± s.d. spectral power from the mPFC time courses for the three frequency bands in healthy (black bars) and CBP (gray bars). CBP exhibited significant increase in spectral power for the high frequency band and decrease for the low frequency band (** p<0.01). (Compare to Figs 2 – 4 in (Malinen et al., 2010))

