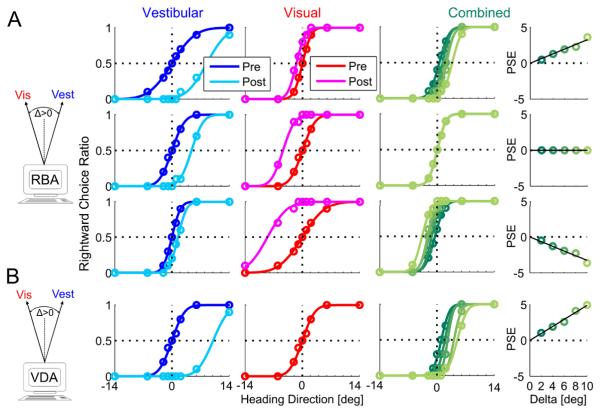
Figure 1. Simulation of multisensory adaptation.
Idealized behavioral responses in a heading discrimination task based on vestibular, visual or both (combined) cues, according to: reliability based adaptation (RBA; A) and visual dominant adaptation (VDA; B). Psychometric plots (middle three columns) represent the simulated ratio of rightward choices, as a function of heading direction. Data (circles) were fitted with cumulative Gaussian functions (solid lines). Baseline performance is presented for vestibular and visual cues by the blue and red curves, respectively. After introducing a heading discrepancy (Δ=10°), vestibular and visual cues adapted to cancel out the discrepancy (cyan and magenta post-adaptation curves, respectively). For RBA, cues shifted according to the visual vs. vestibular reliability ratio (RR), i.e.: for RR=5 (top row) the vestibular cue shifted 5 times more than the visual cue; for RR=1 (second row) cues shifted equally, and for RR=1/5 (third row) the visual cue shifted 5 times more than the vestibular cue. For VDA, the visual cue did not shift (pre- and post-adaptation curves are superimposed); only the vestibular cue shifted. This happens irrespective of RR (RR=1 was used for the example presented here). Dark to light shades of green show the combined-cue responses during adaptation, while gradually increasing Δ = 2°,4°,6°,8°,10°. The combined-cue’s axis (zero) is defined by the heading midway between the cues (schematics on the left). In the rightmost column, the combined-cue point of subjective equality (PSE) is plotted as a function of delta. Solid black lines represent regressions through the origin. For RBA, regression slopes followed the RR: positive for higher visual weighting (top row), negative for higher vestibular weighting (third row) and zero for equal weighting (second row). For VDA the regression demonstrated maximal visual weighting (slope = ½; bottom row).

