
Figure 3. Example of monkey multisensory adaptation.
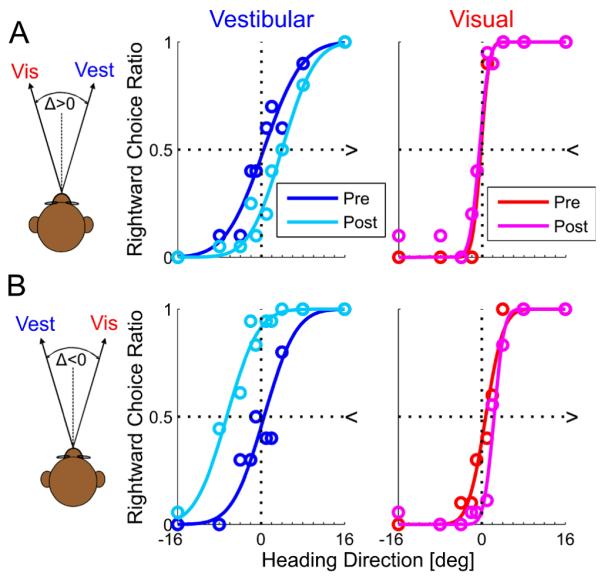
Two sessions from one monkey of visual-vestibular adaptation are presented. For both sessions, visual coherence=100% (RR>1). Plotting conventions are the same as Figures 1 and 2. Opposite visual-vestibular heading discrepancies (Δ) were used for the two examples: In (A) Δ was positive. Hence results can be compared directly to the simulation results of Figure 1 (which also used positive Δ). In (B) Δ was negative. Hence, shifts are expected in the reverse direction. Unlike Figures 1 and 2, there are no combined-cue data during the ‘adaptation’ trials from the monkey experiment. R2≥0.9 for all psychometric fits.