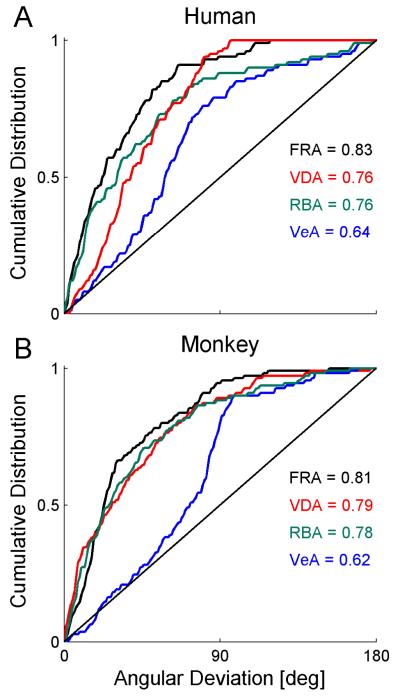
Figure 7. Adaptation data was best represented by a fixed ratio model.
When plotted on the Cartesian plane, vestibular vs. visual PSE adaptation can be described by a vector. The angle of that vector represents the ratio of vestibular to visual adaptation. Here we compared the adaptation-angles extracted from the data, to those predicted from four different models: Fixed ratio adaptation (FRA), visual dominant adaptation (VDA), reliability-based adaptation (RBA) and vestibular dominant adaptation (VeA). The cumulative distribution of the difference between the actual and predicted angles, was plotted for both the human (A) and monkey (B) data. The black diagonal line represents the average cumulative distribution for random angles. The mean of the cumulative distribution is presented on the plots for each model.

