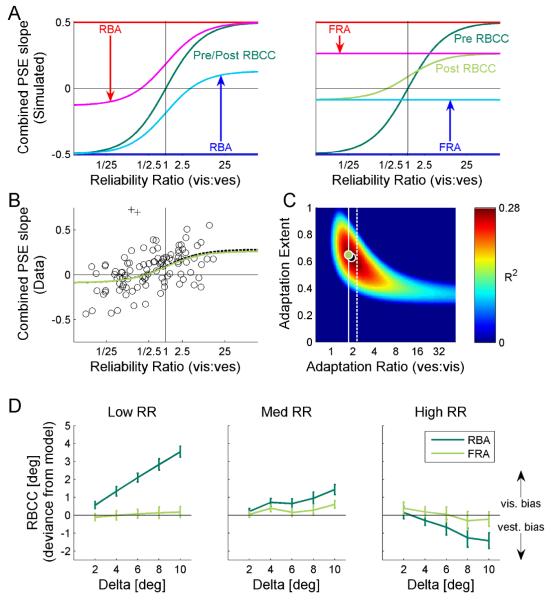
Figure 8. Fixed ratio adaptation accounts for reliability based cue combination.
(A) We present a simulation of the expected reliability based cue combination (RBCC) adaptation. RBCC was quantified by the slope of the combined-cue-PSE vs. delta (as presented in Fig. 1 and 2). Two models of adaptation were simulated: reliability based adaptation (RBA, left plot); and fixed ratio adaptation (FRA, right plot). For FRA, a vestibular to visual adaptation ratio of 1.75 was used (as extracted from the actual cue shifts). For both simulations, partial (65%) adaptation is presented, i.e., the cues did not reach ‘internal consistency’. Prior to adaptation, combined-cue-PSE slopes that would result from visual or vestibular cue dominance are represented by the red and blue horizontal lines, respectively, and post-adaptation by magenta and cyan curves, respectively. RBCC is represented by the dark green and light green curves, pre- and post-adaptation, respectively. For RBA, RBCC remained unchanged (pre- and post-adaptation curves are superimposed). For FRA, the RBCC curve amplitude changed and its y-cut became non-zero. (B) The actual data of combined-cue-PSE vs. Δ slopes is presented (circles). Two outliers are marked by ‘+’ symbols. The optimal FRA model fit is represented by the black dashed curve, and the model fit with adaptation ratio constrained at 1.75 is presented by the light green curve. (C) The R2-values of the FRA model fit for all possible parameters of adaptation-ratio and - extent are presented. The light green and (partially hidden) black dots represent the R2-values for the ratio-constrained and optimal fits, respectively. The white vertical lines represent the adaptation-ratio extracted from the human (solid) and monkey (dashed) data. (D) The average difference between the actual combined PSEs and the models’ predictions are presented. Dark and light green lines show the deviances for RBA and FRA, respectively. Error bars represent the standard error of the mean.

