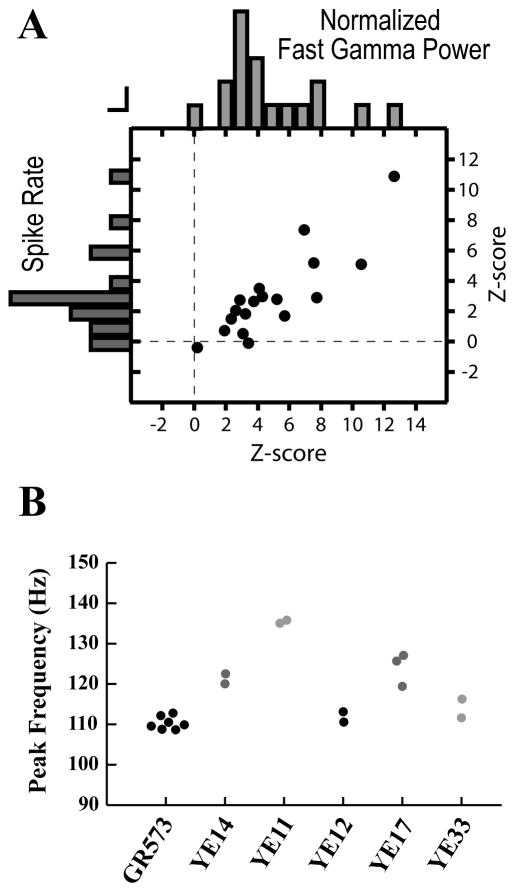
Figure 4. Power in the fast gamma band is positively correlated with spike rate, and the distribution of power in the fast gamma band is conserved across sites within birds.
(A) Z-score for normalized fast gamma power and spike rate during the Post-Vocal period for each site. There is a positive correlation between the magnitude of these changes across sites. Histograms of the z-scores for fast gamma power and spike rate are plotted on the top and left axes, respectively. Vertical and horizontal bars represent a count of 1 for the respective histograms.
(B) Peak frequency is conserved across sites within birds. Each point represents the average peak frequency during Post-Vocal periods for a given site. Peak frequency was defined as the frequency with the greatest power in the fast gamma band calculated from multiunit spike times. Sites are clustered by subject to show the consistency in peak frequency values across sites. Individual subjects are identified by tag number on the x-axis.

