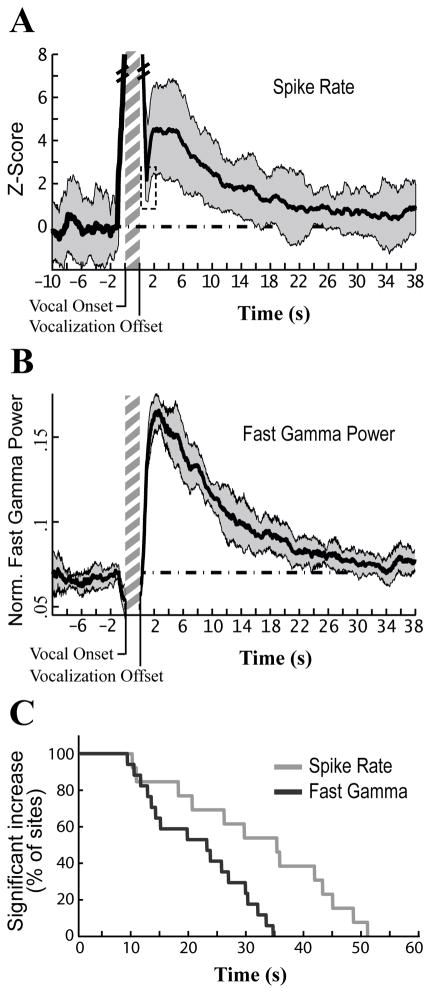
Figure 6. Increases in fast gamma power and spike rate persist for tens of seconds.
(A) Average increase in spontaneous firing rate before and after vocal activity for a representative site. Spontaneous firing rate was measured in 2 s sliding windows (97.5% overlap; dark grey +/− SD). Data plotted preceding vocal onset is the average for all vocal onsets used in Pre-Vocal analysis. Averaged data following vocal offsets were calculated for all songs that did not have any vocalizations in the subsequent 40 s. The dashed line represents the average value during baseline (0 for a z-score). The vertical hatched bar represents a typical length for a bout of song (~2 s). Firing rate remained elevated above baseline levels at this site for 20.65 s. Dashed box, the relatively short period of post-vocal inhibition cannot be properly resolved using a 2 s bin size, which is why spike counts do not drop below baseline here; larger bin sizes increase the reliability of measurements at the cost of temporal resolution.
(B) Average normalized fast gamma power over time for the same site as (A). Fast gamma power was calculated from multiunit activity in 2 s sliding windows as described in (A) (dark grey +/− SD). Oscillation power remained elevated above baseline levels for 26.95 s at this site.
(C) Time relative to vocal offset is plotted against the fraction of all sites whose firing rate remained significantly above baseline up to that time, essentially a reverse cumulative histogram (e.g. 100% of sites had firing rates significantly above baseline 5 s after vocal offset, 0% were significant at 55 s). Only sites that showed a significant increase in spike rate or gamma during the Post-Vocal period were included in this plot.

