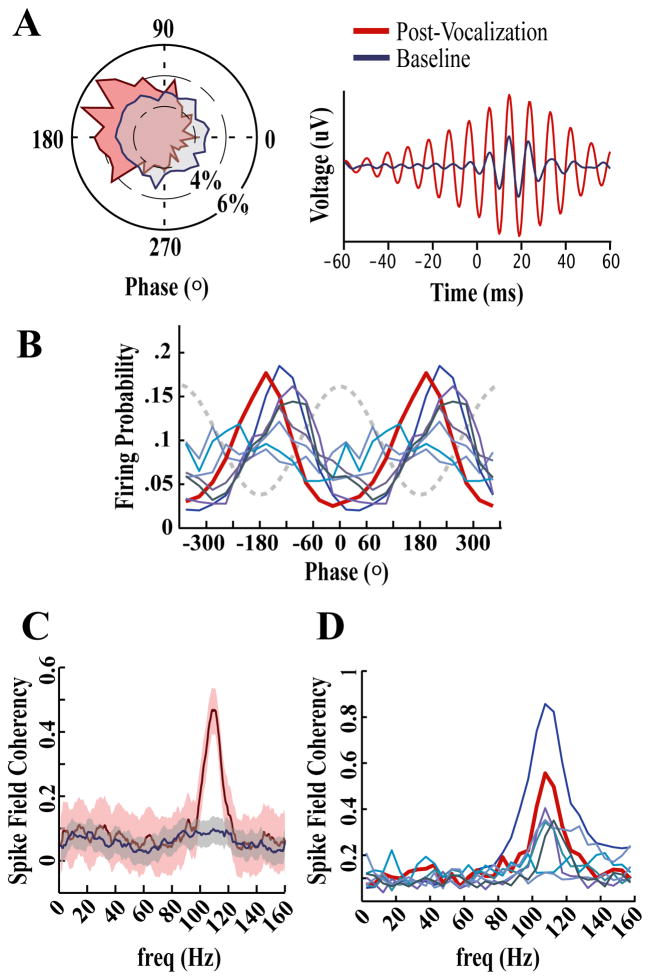
Figure 7. Single units phase lock to underlying fast gamma oscillations.
(A) Circular phase plot (left) and spike-triggered waveform average (STA; right) for an exemplar unit that showed significant phase locking to fast gamma frequencies during the Post-Vocal period (red). Long from the center in the circular phase plot represents the probability of a spike occurring at that phase. To create the STA, LFPs (filtered in the fast gamma range 90–150 Hz using a Butterworth IIR filter) occurring around each spike in the Post-Vocal period, and an equal number of spikes in the Baseline period, were aligned by spike onset and averaged. This exemplar unit was one of a small number of single units that were weakly, but significantly, phase-locked to fast gamma during the Baseline period (blue).
(B) Phase relationship between fast gamma and each significantly phase-locked single unit. Two oscillation cycles are plotted against the probability of firing at each point in the cycle. The dotted line is a representation of the fast gamma waveform. The exemplar from (A) is plotted in dark red. In order to eliminate phase-shifts that occur as the oscillations propagate through the extracellular matrix, phase values for this plot were derived from LFPs recorded at the site of the single unit.
(C) Spike field coherence during Post-Vocal (red) and Baseline (blue) periods for the exemplar site shown in (A). Means are plotted in dark lines with shaded areas indicating 5% jack-knife error bars. Note the similarity between this SFC plot and the modulation spectrum in Figure 5a; these data were calculated using two different sites from the same bird.
(D) Distribution of SFC for each significantly phase locked single unit. The dark red trace represents the exemplar shown in (C).

