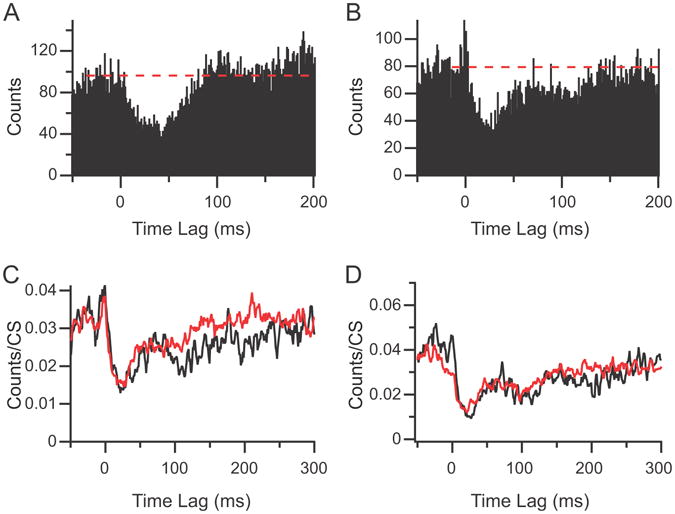
Figure 5.

Inhibitory responses can exhibit distinct morphologies. (A) CS-CN correlogram showing a pure inhibitory response that rises smoothly back to baseline (indicated by dashed line). (B) Correlogram showing an initial excitatory response following by a long duration inhibitory response. Note that there appear to be two components to the inhibitory response: an initial depression in activity that rises rapidly toward baseline, and then a plateau followed by an eventual return to baseline. (C-D) Normalized CS-CN histograms triggered off of isolated CSs (red traces) and CSs succeeded by additional CSs within 200 ms (black traces). Correlograms in (C) are from the same PC as shown in (B).
