
Figure 6.
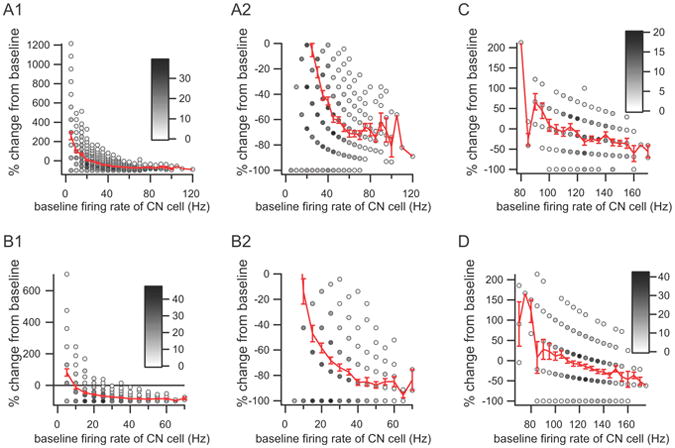
Dependence of CS inhibitory efficacy on CN firing rate. Scatter plots showing the percent change in CN firing rate from baseline versus the baseline firing rate of the CN neuron. (A1, B1, C, D) Each plot shows the relationship between a single PC and CN neuron. The same CN neuron is used in panels C and D but is paired with different PCs. The number of CS trials at each x, y coordinate value is indicated by the gray scale level of the circle interior at the point. The red curve in each plot is the average percent change as a function of baseline CN firing rate. Panels A2 and B2 show a portion of the data of the plots in A1 and B1, respectively, with an expanded y-axis. Baseline CN firing rate was calculated from a 200 ms period ending shortly before the onset of the CS.