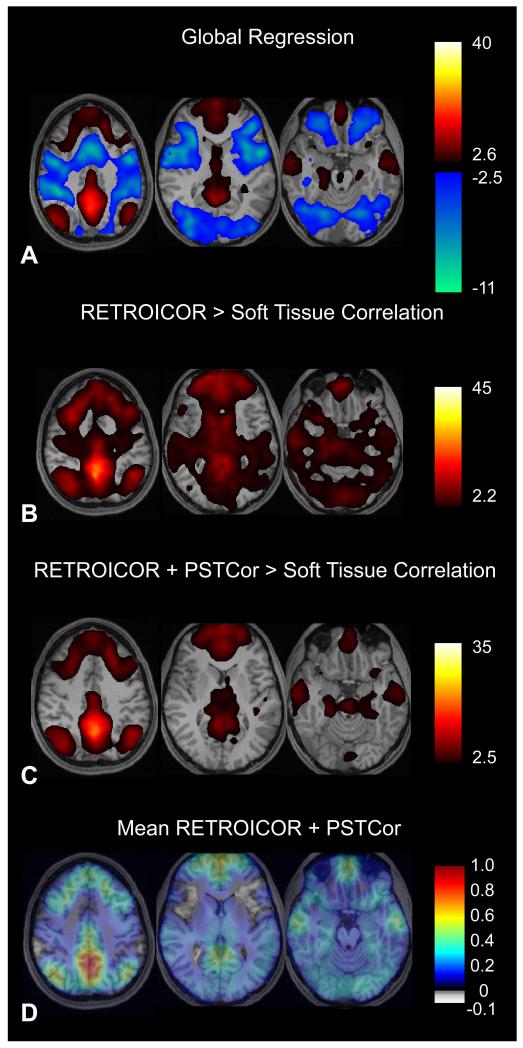
Figure 6.
Default mode network. A. Correlation to posterior cingulate/precuneus seed following global regression (p<0.05, FDR). Slice locations are at z= −18, 10, 48, MNI coordinates. B. Following RETROICOR, images show voxels with significantly greater correlation to posterior cingulate seed than to soft tissue mask. (Paired t-test, FDR corrected, p<0.05). C. Following RETROICOR and PSTCor, images show voxels with significantly greater correlation to posterior cingulate seed than to soft tissue mask. (Paired t-test, FDR corrected, p<0.05). D. Following RETROICOR and PSTCor, images show mean correlation to posterior cingulate seed. Correlation values were converted using Fisher z-transform prior to averaging across subjects, then converted back to correlation values after averaging. Subject left is on image right for all images.

