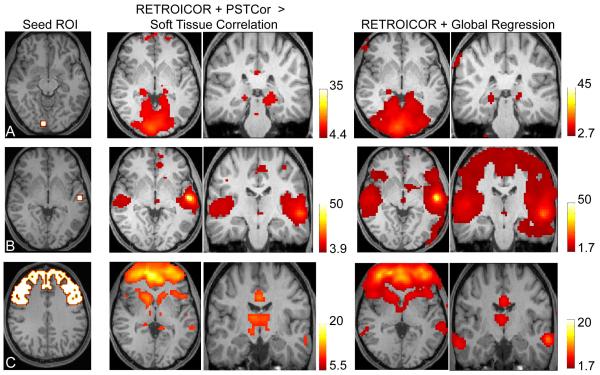
Figure 7.
Anatomic specificity of thalamocortical connectivity. Significance levels were varied to show areas within the thalamus of greatest correlation to the seed region. A. Correlation to right primary visual cortical seed (slice location z=−8, MNI). Center images show correlation to V1 seed greater than correlation to soft tissue mask following RETROICOR and PSTCor (Paired t-test, p<0.001, FDR). Right images show correlation following global regression (p<0.05, FDR. Slice locations: z=1, y=−29, MNI.) B. Correlation to left primary auditory cortical seed (slice location z=1, MNI). Center images show correlation to seed greater than correlation to soft tissue mask following RETROICOR and PSTCor (Paired t-test, p<0.01, FDR). Right images show correlation following global regression (p<0.05, uncorrected. Slice locations: z=1, y=−20, MNI.) C. Correlation to prefrontal cortical mask (slice location z=40). Center images show correlation to seed greater than correlation to soft tissue mask following RETROICOR and PSTCor (Paired t-test, p<0.00001, FDR). Right images show correlation following global regression (p<0.05, uncorrected. Slice locations: z=1, y=−20, MNI.) All images show subject left on image right.

