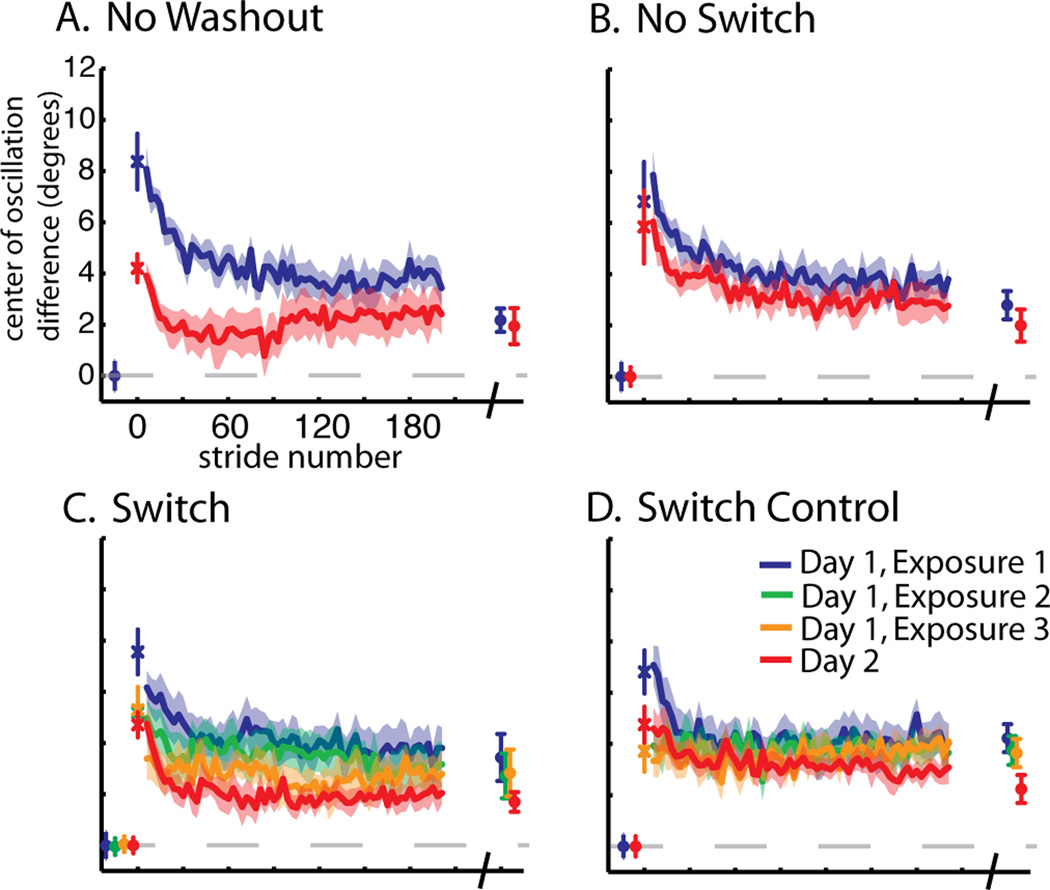
Figure 3.
Comparison of adaptation of center of oscillation difference across groups. Averaged data for the No Washout (A), No Switch (B), Switch (C), and Switch Control (D) groups are shown as in Figure 2. Baseline, first stride, adaptation curves for a portion of training epochs (2–190), and final plateau values are shown.

