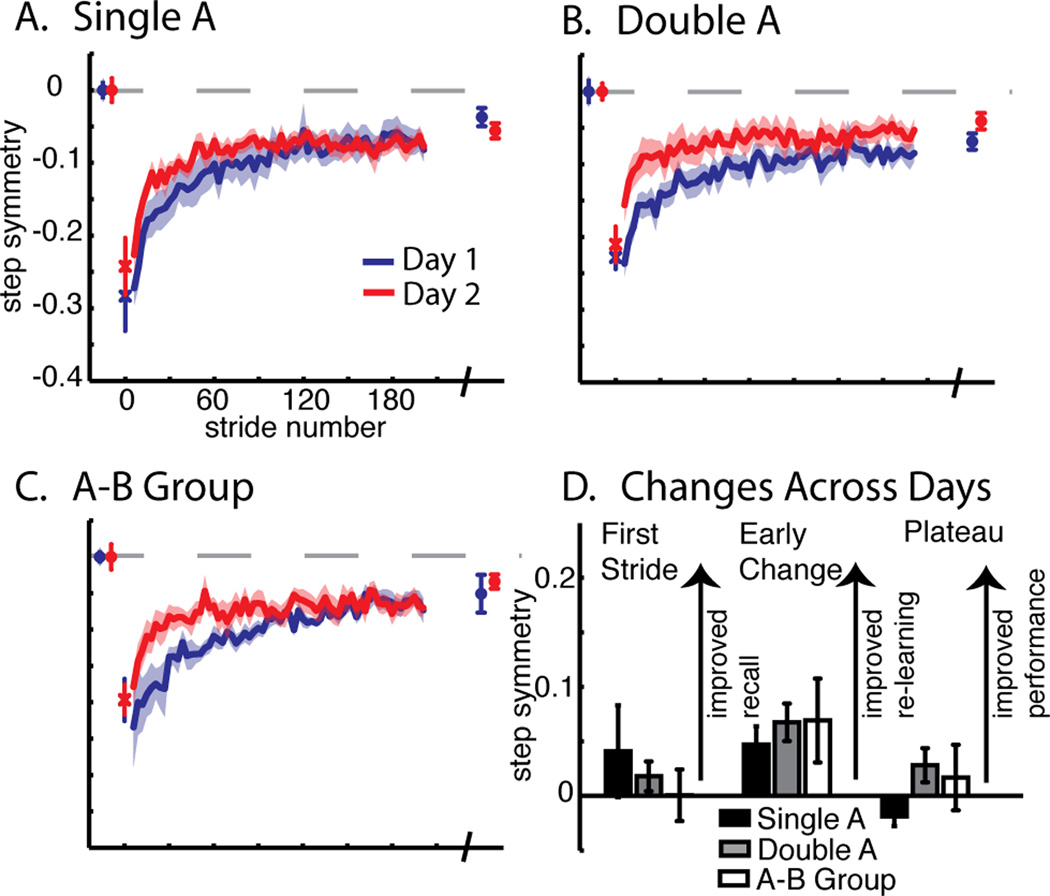
Figure 6.
Comparison of adaptation of step symmetry across groups for Experiment 2. Averaged data for the Single A (A), Double A (B), and A–B Group (C), are shown as in Figure 2. Baseline, first stride, adaptation curves for a portion of training epochs (2–190), and final plateau values are shown. D. Difference between day 1 and 2 for first stride, early change (average of strides 2–30 strides) and plateau (average of last 30 strides). Bars represent group means ± standard error. No significant differences were found for any measure.

