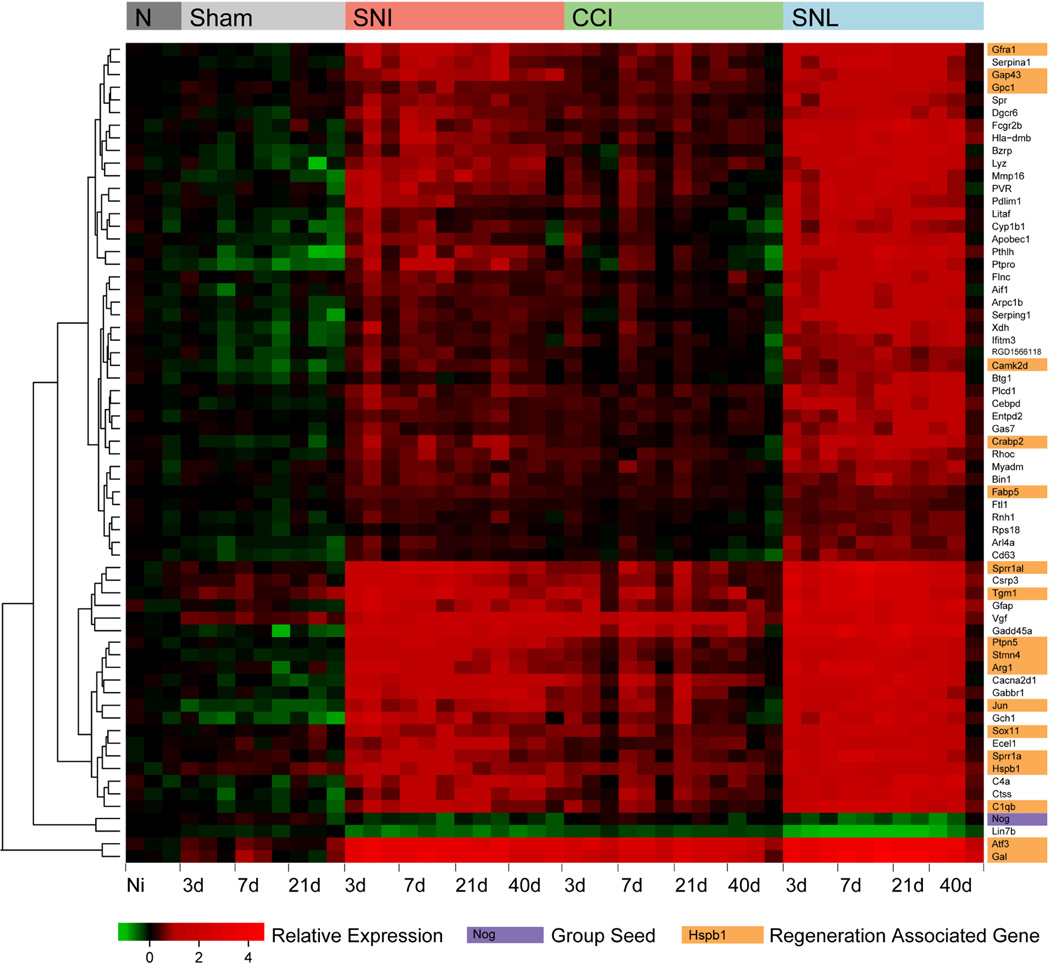
Figure 6. Noggin mRNA expression after peripheral nerve injury negatively correlates over time with the expression of a cluster of regeneration associated genes.
Weighted gene co-expression network analysis/neighborhood network analysis was used to determine a group of 65 genes whose expression across an extensive dorsal root ganglion (DRG) nerve injury dataset most closely relate to Noggin regulation within that group. Heat map showing regulation of these genes in the DRG before (Naïve, N) and after sciatic nerve injury (Spared nerve injury (SNI), Chronic constriction injury (CCI) and Spinal nerve ligation (SNL) –top colored bar) as well as after sham injury (Sham) over time (3, 7, 21 and 40 days) - given below. Each colored block within the heat map represents relative expression of that gene in one array in relation to average naïve expression. Red on this plot represents upregulated, with green representing downregulated relative to average naïve levels. Noggin marked in purple is one of only two downregulated genes present, despite acting as the seed gene whose relative expression across this axonal injury time course was used to choose the most closely related group of 65 genes. The other genes are upregulated after nerve injury but have highly correlated inverse expression patterns to Noggin. To the right are gene names highlighted for function, orange indicates transcripts with a published role in axonal regeneration which have been linked to Hspb1 within (Ma et al., 2011).

