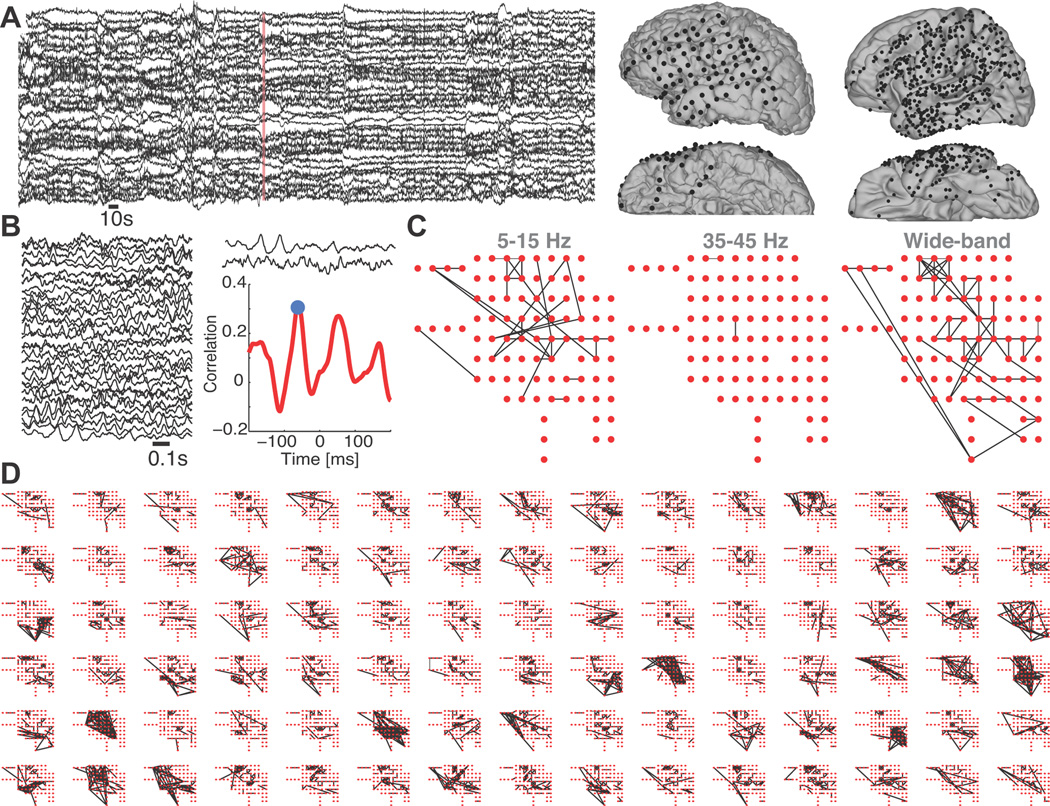
Figure 1. Construction of functional networks from high density, multivariate ECoG data.
(A) Left: Example 10 minutes of ECoG data recorded from 30 electrodes. Right: Electrode locations (black circles) on the lateral and inferior surfaces of the brain for a single subject (left) and composite for all subjects (right) projected onto the left hemisphere. (B) Zoom of 1s of ECoG data (left). For two of these traces, their cross correlation as a function of lead/lag time is show (right). The maximum of the absolute value of the cross correlation (blue circle) determines the significance of the coupling. (C) Example networks constructed for a single 1s interval in the low (5–15 Hz), high (35–45 Hz) and wide-bands. Notice that the high-band network possesses fewer edges (i.e., less significant coupling between electrodes) in this case. (D) Example evolution of wide-band dynamic networks, proceeding from left to right, top to bottom in 1s intervals. From moment to moment, the networks exhibit variable topologies.

