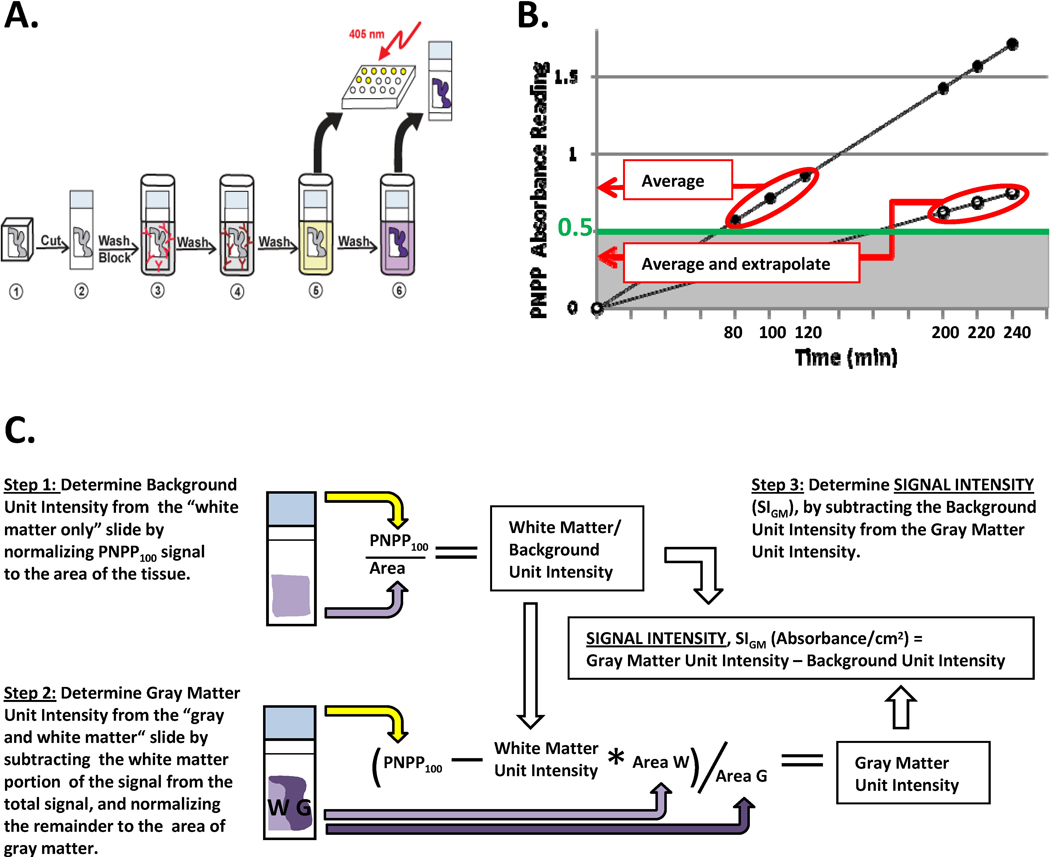
Figure 1. Histelide method.
A. 1 – Formalin-fixed, paraffin-embedded tissue was cut, mounted on glass slides, and deparaffinized; 2 – Slides were washed with TBST and incubated overnight in the blocking solution; 3 – Incubated with primary antibody in blocking solution, followed by washes with blocking solution; 4 - Incubated with secondary antibody in blocking solution, then washed with TBST and DEA solution; 5 - Incubated in the PNPP solution; 100 µL of the solution collected at predetermined intervals, and absorbance read at 405 nm; 6 – Slides were washed with TBST and NTM, incubated in BCIP solution for 30 min, and then washed in PBS and water, dried, coverslipped, and examined by light microscopy. B. PNPP100 was determined by averaging absorbance values at 80, 100, and 120 min of incubation if all three values were ≥ 0.5. If absorbance values at these time points were < 0.5, then PNPP100 was calculated by averaging absorbance at 200, 220, and 240 min time points and extrapolating to 100 min. C. Signal Intensity for gray matter, SIGM, was calculated as the difference between the gray matter unit intensity (gray matter signal per cm2 of tissue) and background unit intensity; we assumed that any signal from pure white matter section for synaptophysin, PHF-tau, or Aβ was background immunoreactivity. Gray matter unit intensity was obtained by subtracting white matter signal from PNPP100 for the entire section that was composed of gray and white matter (Step 2).

