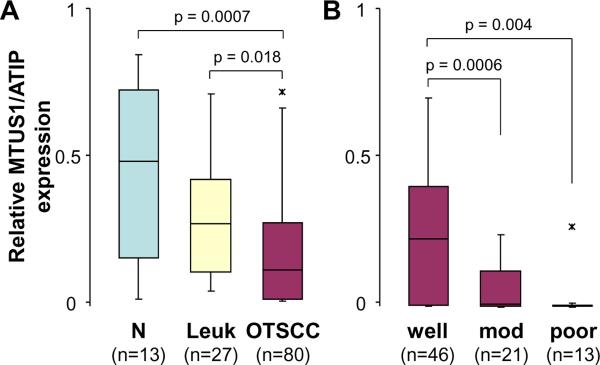
Figure 2.
Relative expression of MTUS1/ATIP in normal mucosa, premalignant dysplasia and OTSCC tissue samples. Box plots were presented for comparing the MTUS1/ATIP immunohistochemistry staining intensities in normal mucosa, premalignant dysplasia (leukoplakia) and OTSCC cases (A), and in OTSCC cases with different grade (differentiation) (B). The p-values were computed using one-way ANOVA. The boxes represent 25th to 75th percentile of the observations, and the lines in the middle of the box represent the median. The whiskers represent maximum (or minimum) observations below (or above) the 1.5 times of the interquartile range, respectively. Outliers are also indicated in the plots as *.

