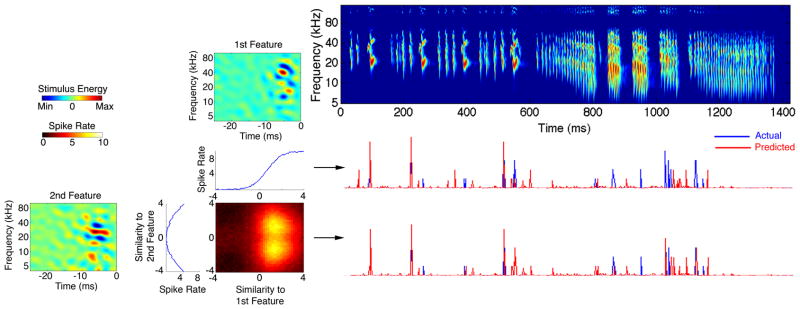
Figure 3. Predictions are Improved When Multiple Stimulus Features are Considered.
The two most informative features for an IC neuron are shown on the left, each with its 1D nonlinearity as well as their combined 2D nonlinearity. The 2D nonlinearity shows how the spiking probability varies when the similarity of the stimulus to both features changes. A spectrogram of a bat courtship song not used in deriving the features is displayed on the right with its evoked response (blue) and predicted response (red) shown in the bottom rows. Mutual information between the response of this neuron and projecting the vocalization through the first and second feature independently was 1.1 and 0.6 bits, respectively. The joint information using both features together increased to 2.2 bits. Therefore, information gain using both features together is greater than the sum of information calculated independently from each feature, resulting in a synergy index of 1.3. The middle row shows the predicted response using only the most informative feature, and its 1D nonlinearity, resulting in a correlation coefficient (CC) of 0.4. Using both features and their combined 2D nonlinearity resulted in the most accurate prediction with a CC of 0.6. This shows that this IC neuron is tuned for multiple spectrotemporal features of natural signals.

