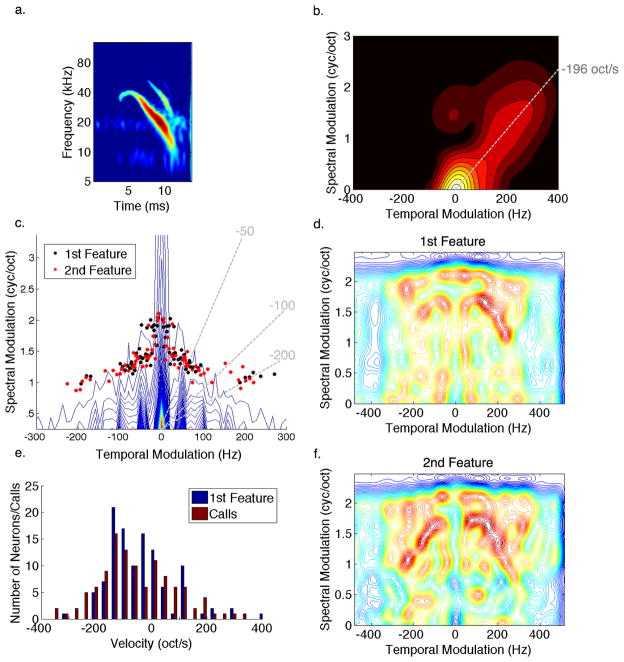
Figure 8. Comparing Spectrotemporal Modulations of Conspecific Signals to Neural Tuning.
(a) A spectrogram of a single syllable taken from a courtship call. (b) The Fourier transform of the syllable shows that most of the energy is concentrated around the origin with a tail that is oriented along a line that indicates the sweeping velocity of the syllable. (c) The contour plot shows the modulation spectrum of all bat calls in our repertoire showing 1/f distribution that is typical of natural signals. The black and red dots designate the peak modulations present in the first and second most informative features of IC neurons, respectively. Note that peak tuning in the IC is organized to detect various FM velocities (dashed lines) while avoiding redundant energy found in most calls. (d,f) Modulation spectrum of the most informative features shows that IC tuning is specifically aligned around the common modulations in the calls in order to be selective for modulations that represent motion cues found in their conspecific signals such as the extended tail in the modulation spectrum of the above syllable. (e) Distribution of FM velocities found in the calls match the velocities of the most informative feature representing the velocity tuning of IC neurons. This suggests that IC neurons are tuned to detect spectral motion cues present in their conspecific social communication signals.

