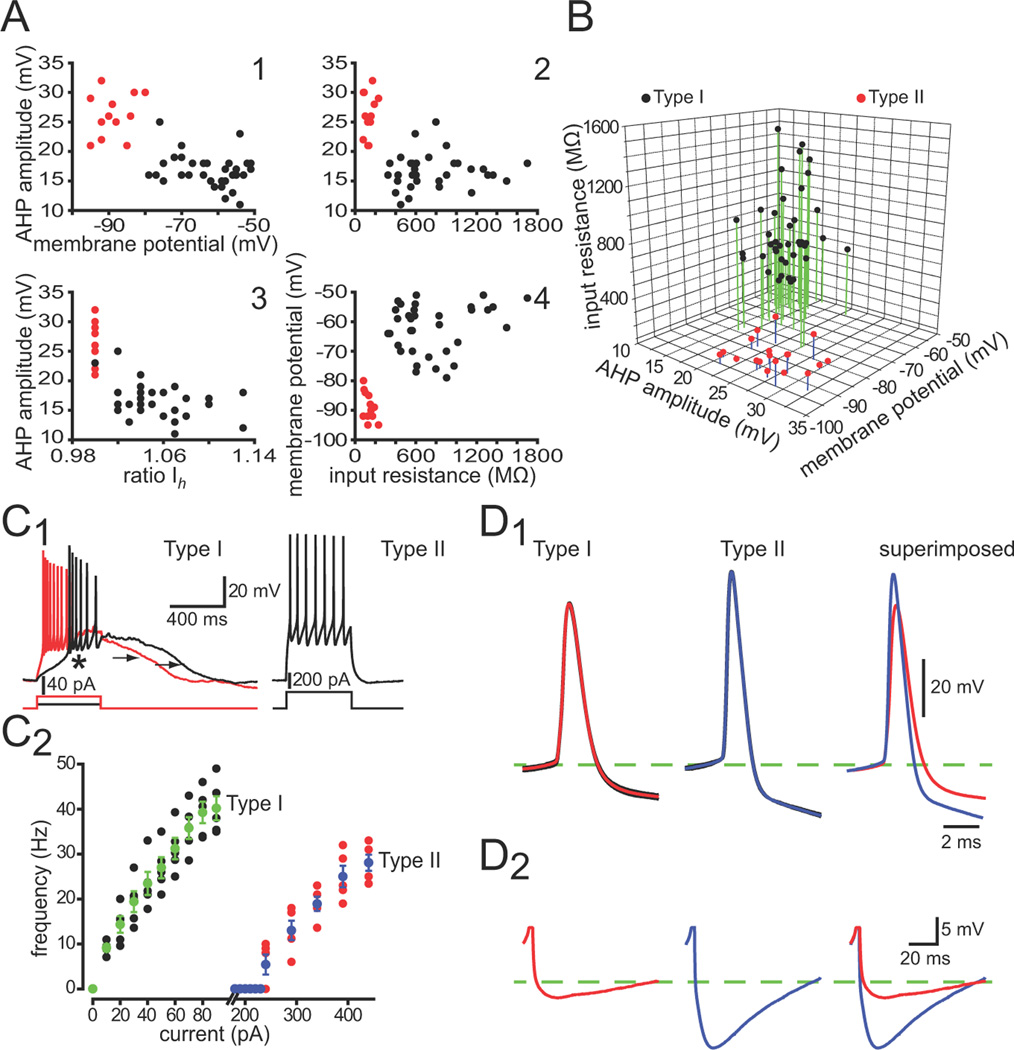
Figure 2.
Whole cell recordings show that Type I and Type II NPY interneurons express different intrinsic electrophysiological properties. A. Selected 2-dimensional scatterplots reveal a clear separation of striatal Type I (black points) and Type II (red points) NPY interneurons based on several electrophysiological parameters. B. Clustering of Type I and Type II NPY interneurons in one representative 3-dimensional scatterplot. C1, C2. Voltage responses to depolarizing current injections for a representative Type I and Type II NPY interneurons reveal clear differences between the two striatal NPY interneuron subtypes. Note the plateau potentials (arrows) evoked in the Type I from rest. In addition, the Type I neuron exhibits a LTS spike (asterisk) in response to a small depolarizing current injection (10 pA) at its resting membrane potential. The Type II neuron responds to a depolarizing current pulse with a simple train of regularly spaced action potentials. D. Averaged evoked action potentials reveal that the Type II neurons exhibit larger and slower spike AHPs than Type I interneurons. Firing frequency was calculated by taking the inverse of the mean interspike interval during a 300 ms depolarizing pulse.

