Abstract
In this study we test the hypothesis that the functional connectivity of the frontal and parietal regions that children recruit during a basic numerical task (matching Arabic numerals to arrays of dots) is predictive of their math test scores (TEMA-3; Ginsburg 2003). Specifically, we tested 4- to 11-year-old children on a matching task during fMRI to localize a fronto-parietal network that responds more strongly during numerical matching than matching faces, words, or shapes. We then tested the functional connectivity between those regions during an independent task: natural viewing of an educational video that included math topics. Using this novel natural viewing method, we found that the connectivity between frontal and parietal regions during task-independent free-viewing of educational material is correlated with children's basic number matching ability, as well as their scores on the standardized test of mathematical ability (the TEMA). The correlation between children's mathematics scores and fronto-parietal connectivity is math-specific in the sense that it is independent of children's verbal IQ scores. Moreover, a control network, selective for faces, showed no correlation with mathematics performance. Finally, brain regions that correlate with subjects’ overall response times in the matching task do not account for our number- and math-related effects. We suggest that the functional intersection of number-related frontal and parietal regions is math-specific.
Keywords: numerical cognition, mathematics, IQ, IPS, fronto-parietal network, fMRI, functional connectivity
1. Introduction
Numbers come in a variety of forms: there are symbolic forms (Arabic numerals, spoken words, etc.) and there are non-symbolic forms (the number of apples in a bag or toots of a horn). Children's abilities to conceptualize numbers in both symbolic and non-symbolic forms are considered important precursors to their subsequent mathematics development (Halberda et al 2008; Lipton & Spelke 2005). Formal math IQ in children can be predicted by their basic numerical skills, such as their capacity to estimate the numerical value of an array of dots (Halberda et al. 2008). Cognitive tasks involving symbolic and non-symbolic numerical forms recruit similar regions of the brain in functional magnetic resonance imaging (fMRI) studies of children and adults: prefrontal cortex (PFC; BA 44, 45,46, 47) and parietal cortex (the intraparietal sulcus, or IPS, and BA 40 & 7) (Ansari et al 2005; Cantlon et al 2009; Dehaene et al 2003; Holloway & Ansari 2010; Piazza et al 2007). If the fundamental ability to conceive of numerical values is related to formal mathematics, we would expect to see a relation between the brain regions that process basic numerical values and children's scores on math IQ tests. Here we examine how the frontal and parietal regions that process basic numerical information interact during cognitive processing and whether that interaction predicts formal math performance in children.
Several researchers have proposed that mathematical knowledge develops via changes to a fronto-parietal network (Ansari & Dhital 2006; Ansari et al 2005; Cantlon et al 2009; Nieder 2009; Rivera et al 2005). At the core of this hypothesis is evidence that children recruit both parietal (BA 7, 40) and prefrontal regions (BA 9, 44,45,46,47) during formal math tasks but the relative intensity of the frontal versus parietal response changes over development (Rivera et al., 2005). Rivera and colleagues (2005) collected fMRI images of participants between ages 8-20 while they were presented with simple arithmetic problems and asked to respond if the problem was correct. Although all participants showed perfect accuracy, their reaction times (RT) significantly decreased with age. The fMRI results revealed greater activation of prefrontal regions and reduced activation of left parietal cortex in children compared to adults. Their interpretation of this pattern of results is that the greater frontal activation in children reflects the greater demands on memory and attention resources that children require in order to achieve similar levels of mental arithmetic performance to adults.
Another interpretation of the role of fronto-parietal activation in mathematical development comes from studies of non-human primate neurophysiology. Neider and colleagues (Nieder 2009; Nieder et al 2002; Nieder & Merten 2007) have discussed possible interactions among neurons in prefrontal and parietal cortex during numerical processing in monkeys. They recorded the activity of parietal and prefrontal neurons in nonhuman primates who were trained to associate Arabic numerals with their non-symbolic numerical values from visual element arrays. Neurons in both parietal and prefrontal cortex elicited responses specific to the numerical values of the non-symbolic visual arrays. The parietal and prefrontal neurons also represented symbolic numerical values; however, only the prefrontal neurons represented a given symbolic numerical value and its non-symbolic counterpart within the same neuron. This suggests that prefrontal neurons are uniquely able to associate a specific non-symbolic numerical value with an Arabic numeral as its symbol. The authors proposed that the prefrontal cortex is involved in forming the semantic links between symbolic and non-symbolic representations of numbers.
Cantlon and colleagues (2009) have reported a related result in young children (6- to 7-year-olds). In that study, children who were still learning the values of Arabic numerals were asked to compare a pair of numbers (either Arabic numerals or dot arrays, depending on the block) and choose the larger quantity. They examined regions that showed a conjunction overlap between the symbolic Arabic numerals condition and the non-symbolic dot arrays condition. The regions that showed conjunction overlap were similar for adults and children (prefrontal BA 6, 9, 13, 44, the IPS, and parietal BA 7); however, they observed greater prefrontal activity in children when compared to adults and similar activation of parietal cortex across age groups. They proposed that the prefrontal cortex is more active in children because it plays a mediating role in the association of abstract numerical symbols (Arabic numerals) with their semantic values. Under this view, children would be expected to show reduced recruitment of the prefrontal regions that are important for processing Arabic numerals and, perhaps, reduced fronto-parietal connectivity during Arabic numeral processing as they gain proficiency with Arabic numerals.
In studies with adult subjects, BOLD adaptation has been used to identify brain regions that process both non-symbolic (dots) and symbolic (Arabic numeral) stimuli. For example, Piazza and colleagues found that regions of the IPS adapt to repeated presentations of both symbolic and non-symbolic numerical stimuli. Following adaptation, the BOLD response in the IPS recovers as a function of the numerical difference between adapted and novel numbers. Thus, the IPS represents numerical values during passive numerical processing in adults. Their study also revealed extended numerical distance-related activation in bilateral prefrontal and inferior frontal cortices, including the anterior insula. These prefrontal data suggest that pre-/inferior frontal regions continue to play a part in coding for numerical information across notations beyond childhood.
The studies reviewed above establish the importance of the amplitude of BOLD activation for identifying the brain regions recruited during numerical cognition. However, recent studies have shown that the functional connectivity between brain regions is also an important parameter for predicting individual performance differences. Functional connectivity is defined as the temporal correlation between spatially distinct neurophysiological events, expressed as a correlation across those events (Friston et al 1993). Many researchers have observed functional connectivity from task-independent “resting state” fMRI scans (Fox et al. 2005, or see Van Dijk et al 2010, for a review). Those studies provide evidence of functional links between brain regions in the absence of a focused experimental task.
Other studies have found evidence of functional connectivity during focused tasks such as language processing. For example, Hampson and colleagues (2006) found that the functional connectivity between two areas associated with language processing (Broca's and Wernicke's area) showed increased functional connectivity when subjects engaged the language system by listening to a narrative text. Functional connectivity during rest has also been shown to change in tandem with changes in behavioral performance over time. For example, Lewis and colleges (2009) demonstrated that training on a visual perceptual learning task in adults modifies the functional connectivity of networks engaged by the task. Specifically, after intense training on a shape-identification task, resting BOLD functional connectivity between visual cortex and frontal-parietal areas involved in the control of spatial attention were significantly altered and, importantly, the changes in connectivity correlated with the degree of perceptual learning. These studies establish that intrinsic functional connectivity, measured with a wide range of tasks, is a dynamic predictor of changes in behavior.
Taken together, the studies summarized above prompt the hypothesis that functional connectivity between brain regions recruited during numerical tasks, including the IPS and PFC, predicts children's performance on formal mathematics tests. That hypothesis is the focus of the current report.
To test the hypothesis that fronto-parietal connectivity predicts mathematics development, we used a novel experimental paradigm. We first localized regions that are important for processing numerical information using a traditional task: matching Arabic numerals to arrays of dots. We then tested functional connectivity in an independent data set from a natural viewing task in which subjects passively viewed a 30-minute Sesame Street video which included math topics. Natural viewing paradigms have previously been shown to activate content-specific representations in adults (Hasson et al., 2004). We therefore expected this natural viewing paradigm to provide a useful index of the functional connectivity of numerical processing regions in children. Moreover, it is possible that this naturalistic task provides a more ecologically valid measure of brain functions underlying formal mathematics development.
2. Materials and Methods
We tested children ages 4-11 years using two different cognitive paradigms during fMRI: we tested children with a formal numerical matching task to localize number-related activation and then we tested the functional connectivity of those regions during a natural viewing task in which subjects watched an educational video of numbers, letters, and other concepts (see Cantlon & Li, under review, for discussion of natural viewing stimuli). To test functional connectivity we used an fMRI co-activation method (Fox et al. 2005, Hampson et al. 2006, Lewis et al. 2009), correlating time-course activity between frontal “seed” regions and the IPS. Children were administered a series of IQ tests outside of the scanner.
2.1 Participants
Thirty-five typically developing children (ages 4.32 to 11.86, mean age = 8.24 years, sd = 2.26) and 20 adults (ages 18.9 to 25.4 mean age = 20.7 years, sd = 1.7) were tested on the full set of experimental conditions. Three of the children were excluded due to excessive head motion in both fMRI paradigms (>5 mm) and one additional subject was excluded due to experimenter error. Seven children were excluded from analyses because they performed at or below chance on the matching task, leaving twenty-four children total. Two children were unable to complete the standardized tests after the fMRI portion of the experiment and so they are only included in the fMRI components of the study, not the behavioral analyses. The mean motion deviations for the twenty-four child participants (after online motion correction) were 1.24 mm translation (σ = 0.82) and 1.47 degrees rotation (σ = .96).
All participants had normal or corrected to normal vision with no history of neurological impairments or abnormalities. All guidelines and requirements of the University of Rochester's Research Subjects Review Board were followed for participant recruitment and experimental procedures.
2.2 Task Design
We used fMRI to measure children's BOLD activity during two different numerical processing tasks: 1) a formal matching task and, 2) free-viewing of a twenty-minute educational video montage of Sesame Street.
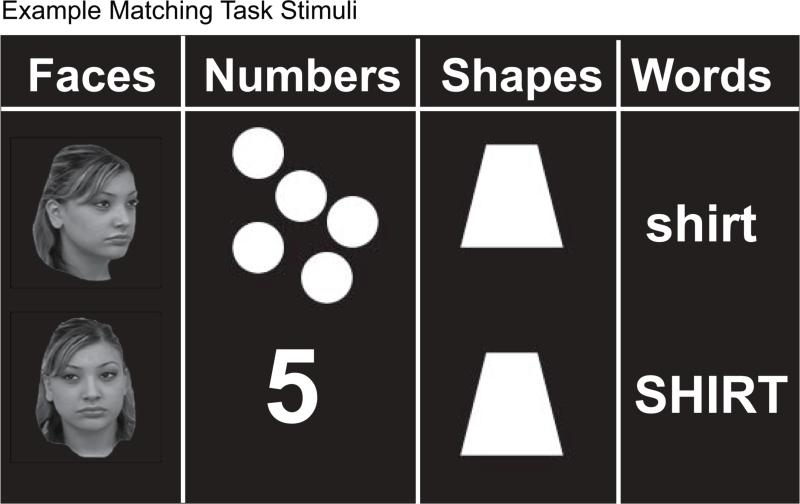
In the formal matching task (Figure 1), children and adults compared pairs of stimuli presented on a computer monitor and reported whether the stimuli were the same or different. The stimuli consisted of pairs of images (faces, numbers, words, or shapes) presented to the left and right of a central crosshair. Subjects were told to press a response button when the two stimuli in a pair matched. Number pairs were to be matched across notation: digits-to-dot arrays. Face pairs were to be matched across orientation: one from the front and one at an oblique angle. Word pairs were varied in case (upper or lowercase). Shapes were either identical or different. Each child completed two runs of twelve blocks. A single run contained three blocks per category, each lasting twenty seconds and presented one pair of stimuli every two seconds. Stimuli were presented as grey-scale (faces) or white (letters, shapes, Arabic numerals/dot arrays) images on a green background. When a pair of stimuli was presented, participants were instructed to press a response button only if the two stimuli matched. No response was taken to indicate a “non-match”. Fifty percent of the trials, distributed at random across each stimuli type, were “matches”, while the other 50% were “non-matches”. Accuracy and reaction time were measured for the matching task and only children who performed above chance (50%) were included in the functional connectivity analysis. We required that children perform above chance because we could not otherwise guarantee that children attempted to perform the task. Twenty-four children met this criterion (ages 4.75 to 11.86, mean age = 9.26 years, sd = 1.83).
Figure 1.
Example stimuli from each of the conditions in the formal matching task are shown.
In the free-viewing video task (Figure 2), participants viewed a single 20.3-minute run of a “movie” comprised of clips from the children's educational television shows. Individual clips ranged from 12 to 176 seconds in length and were edited into one continuous movie using iMovie software. Crossfade transitions of 4 seconds were used to transition from one clip to the next. The content of the movie clips generally included lessons on letters and numbers but also simultaneously featured other topics and entities such as different people, puppets, songs, buildings, and the concepts of saving money, food, and Egyptian culture. Eight clips that featured letters and/or words comprised 28.3% of the total “movie” duration, 6 clips that featured numbers and/or mathematics comprised 36.2% of the “movie” duration, and 4 clips that featured other objects (i.e. shapes, astronomy, pyramids) comprised the remaining 35.5%. Participants were instructed to remain motionless while watching the movie but were given no instructions to fixate or restrict eye movement. We used these natural educational stimuli because they have the potential to elicit more ecologically valid neural processes during mathematical thinking in children (see Cantlon & Li, under review for evidence and discussion). We also chose to use the video task as an independent data source in which the BOLD response is not correlated with the design matrix in the functional connectivity analyses.
Figure 2.
Example frames from the 20-minute Sesame Street video.
A short quiz was administered at the end of the scan session to ensure that participants attended to the movie (all included children performed significantly above chance on the quiz, Mean Accuracy = 76.5%).
2.3 Standardized Tests
Standardized tests were generally administered immediately following the fMRI scan, outside of the scanner. The TEMA-3 mathematics test and the KBIT-2 verbal and nonverbal IQ tests were administered.
The TEMA-3 (H.P. Ginsburg 2003) is a standardized test of the mathematics ability of children between the ages of 3 years 0 months and 8 years 11 months. The TEMA-3 measures both formal (i.e. number facts, numeral literacy) and informal (i.e. relative magnitude) mathematics skills. The TEMA-3 was standardized on a sample of 1,228 children across 15 U.S. states. Standardized scores for the TEMA-3 are presented with a mean of 100 and a standard deviation of 15, and reliability coefficients are reported to range from 0.82 to 0.97. Total TEMA-3 testing time was approximately 30 minutes. The test administrator scored all TEMA-3 results online, and 12 of the 19 were rescored offline by a second coder with 100% inter-rater reliability.
The KBIT-2 (A. S. Kaufman 2004) is a standardized test for ages 4 to 90 that measures verbal and nonverbal intelligence. Verbal intelligence (so-called school-related skills) is measured by assessing word knowledge, verbal definitions, and verbal reasoning ability. Non-verbal intelligence is measured by assessing participants’ ability to perceive relationships and complete pictorial analogies. The K-BIT-2 was standardized on a sample of 2,120 English-speaking individuals between the ages of 4 and 90 across 34 U.S. states and the District of Columbia. Standardized scores for the KBIT-2 are presented with a mean of 100 and a standard deviation of 15, and internal-consistency reliability coefficients across the 4 to 90 age-range are reported to range from 0.88 to 0.93. Total KBIT-2 testing time was approximately 20 minutes. The test administrator scored all KBIT-2 results online.
2.4 MR parameters
Whole brain BOLD imaging was conducted on a 3-Tesla Siemens MAGNETOM Trio scanner with a 12-channel head coil at the Rochester Center for Brain Imaging. High-resolution structural T1 contrast images were acquired using a magnetization prepared rapid gradient echo (MP-RAGE) pulse sequence at the start of each session [TR = 2530 ms, TE = 3.44 ms flip angle = 7 degrees, FOV = 256 mm, matrix = 256 × 256, 160 or 176 (depending on head size) 1×1×1mm sagittal left-to-right slices].
An echo-planar imaging pulse sequence with online motion correction was used for T2* contrast (TR = 2000 ms, TE = 30 ms, flip angle = 90 degrees, FOV = 256 mm, matrix 64 × 64, 30 sagittal left-to-right slices, voxel size = 4×4×4mm). The first 2 TRs of each run were discarded to allow for signal equilibration. The “movie” run of the natural viewing paradigm was conducted in one functional run of 610 volumes. The matching paradigm was conducted in 4 functional runs of 132 volumes each. Total scanning time was approximately 40 minutes.
2.5 Preprocessing
Data were processed using BrainVoyager QX 2.0 (Brain Innovation; Goebel et al. 2006), along with BVQX in-house MATLAB scripts. The first 2 volumes from each localizer data set and each movie data set were removed to allow longitudinal magnetization to reach steady state. Functional data sets were then preprocessed; steps included rigid-body motion correction, slice scan timing correction, linear trend removal, and high pass filtering (3 cycles per series cutoff). The data from the free viewing task were also spatially smoothed using 8 mm--full-width at half-maximum (FWHM) Gaussian kernel (following Hasson et al., 2004). Functional data from the formal matching task were not smoothed.
Functional data were coregistered to high-resolution anatomical images, which were in turn normalized to Talairac space (J. Talairach 1988). Normalization was performed in 2 steps: images were first aligned with stereotactic axes and then transformed to the Talairach grid using a piecewise affine transformation based on manual identification of the anterior and posterior commissure and the edges of cortex along each axis. Subsequent analyses were performed on preprocessed data in a space of 1-mm isovoxel resolution aligned with Talairach space.
2.6 ROI Definitions
A general linear model (GLM) analysis was conducted on the functional data. A GLM with a contrast of numbers greater than all other categories (Numbers > Faces, Words, & Shapes) at a FDR corrected threshold of p < .05 yielded four regions of interest. These regions included: (1) bilateral PFC/IFG/anterior Insula, corresponding to BA 47 /13; (2) bilateral IPS corresponding to BA 40. ROIs were labeled according to the Talairach and Tournoux (1988) atlas.
2.7 Functional Connectivity
Using the data from the free-viewing video task, time series from all voxels within the frontal ROIs (defined by the localizer number matching task) were averaged to create a single time series for each frontal region, for each subject. Then, within each hemisphere, the average timecourse from the frontal ROI was correlated with the timecourse in each voxel of the parietal ROI for each subject. The average of the r-values from each voxel within the IPS ROI was used as a measure of the connection between the number-related IPS and PFC regions. To reduce the influence of variation unrelated to neural activity on connectivity analyses, nuisance variables were removed from the movie data via linear regression. These included the global mean signal and 6 motion parameters. . The degrees of freedom in all functional connectivity tests were corrected using a Fisher transformation. The individual frontal-to-parietal connectivity r-values were then correlated with performance on the standardized math test, performance on the formal localizer task, and age across subjects.
2.7 Control Analyses
Two additional control analyses were conducted in order to assess the specificity of our functional connectivity findings. For the first control analysis, we extracted face-selective regions from the contrast of Faces > Numbers, Words, & Shapes on the localizer data from children (FDR-corrected, p < .05). That contrast yielded a region of the fusiform gyrus approximating the fusiform face area and a region of ventral prefrontal cortex. We measured the functional connectivity between those two regions using data from the free-viewing movie task, just as we did for the number-related network. We then tested whether the connectivity between ventral prefrontal cortex and the fusiform gyrus correlates with children's mathematics test scores.
In the second control analysis, we tested a GLM model with the duration of reaction time as a regressor on the localizer data from children. The reaction time regressor was tested across all conditions (faces, numbers, words, & shapes) in order to identify brain regions that were modulated by the amount of time it took for participants to respond regardless of condition. We then compared those regions with our number-selective regions. The goal was to determine whether the number-selective network that we identified in the localizer is sensitive the general difficulty of the task, independently of content.
3. Results
3.1 Performance on the Matching Task and Standardized Tests
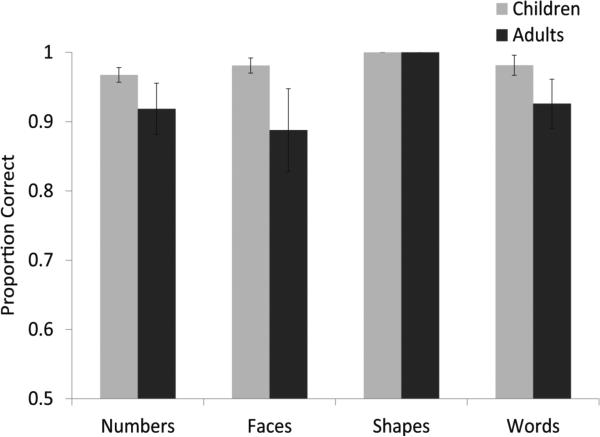
Figure 3 shows accuracy and RT for children and adults on the four conditions of the matching task. The data show that both groups performed significantly above chance (50%) on all conditions and that the conditions were similarly difficult. The shapes condition was marginally easier than each of the other three conditions but no other performance differences among the conditions were observed (see Figure 3). For Children, mean accuracy for ‘numbers’ (mean= .97) was not significantly different from ‘faces’ (mean=.98, t= -.80, p =.42) or ‘words’ (mean=.98, t= .90, p=.37). Likewise, RT for ‘numbers’ was not significantly different from ‘faces’ (mean=1179ms, t= 1.34, p =.19) or ‘words’ (mean=1273, t= 1.06, p=.30). These behavioral data show that the number task was not significantly more difficult than the other three tasks for children. Therefore, BOLD activation related to numbers in our fMRI paradigm cannot be explained easily by increased task demands since those factors were generally controlled across tasks.
Figure 3a.
Reaction times for each of the conditions in the formal matching task are shown for both children and adults. Error bars are marked.
Figure 3b.
Accuracy for each of the conditions in the formal matching task is shown for both children and adults. Error bars are marked.
As expected, adults were significantly faster than children at matching numbers (t=3.94, p<.01), faces (t=7.13, p<.01), shapes (t=8.00, p<.01), and words (t=5.06, p<.01). Although both groups performed above chance, number matching accuracy was slightly lower in adults (mean=.89) than in children (mean=.97, t=-2.90, p<.01), but there were no age-related differences for faces (t=-1.00,p=.32), shapes (t=0 ,p=1), or words (t=-1.66,p=.10). The age-related difference in accuracy for the numbers condition is likely due to a difference in speed accuracy weighting in children compared to adults: children were slower than adults but more accurate. The important result is that overall performance on all four conditions was remarkably similar within each age group.
For children, the mean TEMA-3 standardized score was 106 (σ =4) and the mean KBIT-2 standardized score was 108 (σ = 14). Thus, the children in our sample performed within the normal range on both the mathematical and general IQ tests.
3.2 Number-specific responses in Formal Matching Task
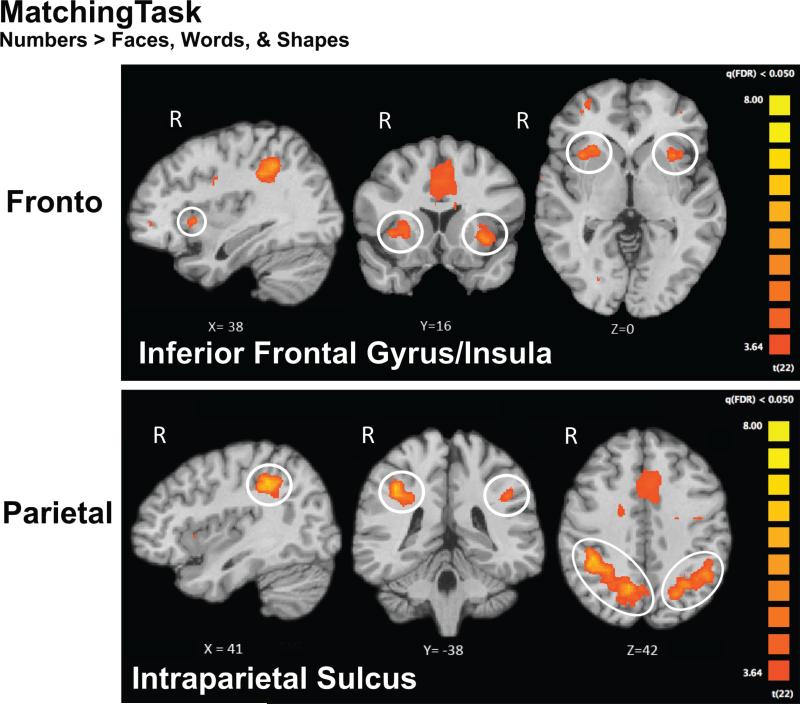
We used the fMRI data collected during the matching task to localize areas of the brain that showed category-selectivity for numbers (Numbers > Faces, Words, & Shapes, FDR q < .05) in children and adults. The analysis revealed number-selective regions in frontal and parietal cortex for both groups (Figure 4). Number-selective activations included the IPS and PFC. Peak activation loci are labeled in Figure 4. Table 1 presents the peak coordinates of all number-related activation sites that formed at least 300 contiguous 1×1×1 mm voxels.
Figure 4.
fMRI results from children during the Matching Task for the contrast Numbers > Faces, Words, & Shapes. All maps are FDR corrected at q < .05. These frontal and parietal regions were used as ROIs in the functional connectivity analyses.
Table 1.
Peak loci for Number-related, RT-modulated, and Face-related activation.
| Talairach |
|||||
|---|---|---|---|---|---|
| Area of Activation | Cluster Size (cm3) | Peak X | Peak Y | Peak Z | |
| Number Network | |||||
| Right Intra-Parietal Sulcus | 1.4 | 41 | -38 | 42 | |
| Left PFC: IFG/Insula | 0.1 | -34 | 16 | -6 | |
| Left Intra-Parietal Sulcus | 2.2 | -46 | -47 | 33 | |
| Right PFC: IFG/Insula | 0.6 | 38 | 16 | 0 | |
| Anterior Cingulate | 13.4 | 20 | 1 | 54 | |
|
Reaction Time Network | |||||
| Right PFC: IFG/Insula | 10.1 | 38 | 13 | 6 | |
| Anterior Cingulate | 15 | 2 | 10 | 27 | |
| L Precentral/ Postentral Gyrus | 12.6 | -34 | -26 | 48 | |
| Left PFC: IFG/Insula | 11.2 | -31 | 13 | 12 | |
|
Face Network | |||||
| Medial Frontal Cortex | 1.1 | 8 | 34 | -6 | |
| Fusiform Gyrus | 0.7 | 29 | -37 | -17 | |
The pattern of fronto-parietal activation observed in children broadly replicates the pattern of activations from previous studies of numerical processing that tested ordinal numerical comparison (Cantlon et al 2009; Holloway & Ansari 2010), arithmetic (Rosenberg-Lee, Barth, and Menon, in press), numerosity adaptation (Cantlon et al 2006; Piazza et al 2004), and numeral priming (Eger et al 2003). The peak activations of our parietal regions are within 14mm of previously reported activation for number responsive cortex (Ansari et al 2005), and within 11mm of activation reported by Cantlon and colleagues (Cantlon et al 2006). Our coordinates also fall within 10 mm of peak activity related to arithmetic ability in adults (Dehaene et al 1998) and peak adaptation for approximate numerical quantities (Piazza et al 2007). The spatial extent of our IPS activations appears to overlap activation sites of prior numerical cognition fMRI studies.
PFC activations are between 6mm (left frontal) and 10mm (right frontal) of the activations reported in adults during a numerosity adaptation task that involved both symbolic and non-symbolic numbers in adults (Piazza et al 2007). Our right PFC activations also fall within 16mm (Cantlon et al 2009) and 8mm (Holloway & Ansari 2010) of right hemisphere frontal activations reported for both Arabic numerals and dot arrays in children. These proximities are not reported to suggest that the same frontal region has been measured across all of these numerical cognition studies. Indeed, the peak of the frontal region that emerged in the current study is closer to the insula than most previous studies. Yet, the spatial extent our frontal activation appears to overlap inferior frontal activations from several prior numerical cognition studies.
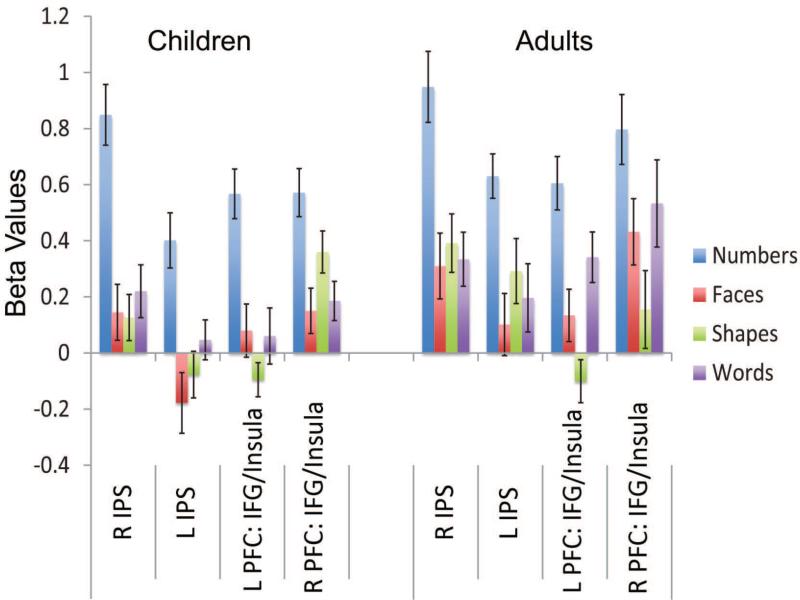
The mean response amplitude (beta values) for each of the matching task conditions is shown in Figure 5a, for children and adults. Number-related response amplitude was similar for children and adults, showing no significant differences in mean response across age group in right IPS (t=.60, p=.55), left IPS (t=1.49, p=.14), right PFC (t=1.66, p=.10), or left PFC (t=.28, p=.77). Age-related differences in amplitude were not observed even when we divided our child sample into young children (ages 4-8) and old children (ages 9-12). Those data are shown in Figure 5b.
Figure 5a.
Average Beta values for each region of interest (ROI) and for each condition, for children and adults from the Matching Task. As expected, Beta values for numbers show the highest response in each region for both age groups. There were no age-related differences in the amplitude of the number-related response. Error bars are marked.
Figure 5b.
No amplitude differences in number-related responses were observed between age groups even when children were split into younger and older children. Error bars are marked.
3.3 Functional Connectivity and Math Performance in Video Task
We used the number-selective regions that were localized using the fMRI matching task as the basis for our functional connectivity analyses. Specifically, we tested connectivity between the PFC and IPS regions that emerged from the number matching task following the claims of fronto-parietal involvement in number development discussed in prior studies (Ansari & Dhital 2006; Cantlon et al 2009; Dehaene et al 2003; Nieder et al 2002; Piazza et al 2007; Rivera et al 2005).
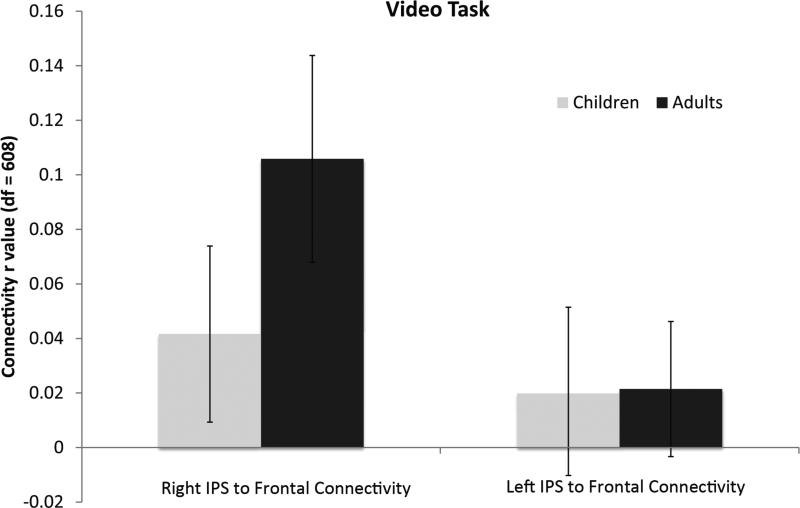
We measured the connectivity between the PFC and IPS regions within-hemisphere for each age group. Overall mean connectivity strength in this fronto-parietal network is shown for each age group in Figure 6. As a group, adults showed significant fronto-parietal functional connectivity (average r=.11, p <.01, df=608). In contrast, children did not show a significant degree of functional connectivity in either hemisphere as a group (average r=.04, p=.32, df=608). Instead, children exhibited increases in connectivity strength that were dependent on age, number task performance, and math IQ.
Figure 6.
Mean functional connectivity between frontal and parietal ROIs was calculated for each group of subjects, in each hemisphere, over the 20-minute video timecourse. At the group level, right hemisphere PFC-IPS connectivity was significant in adults, but not in children. Error bars are marked.
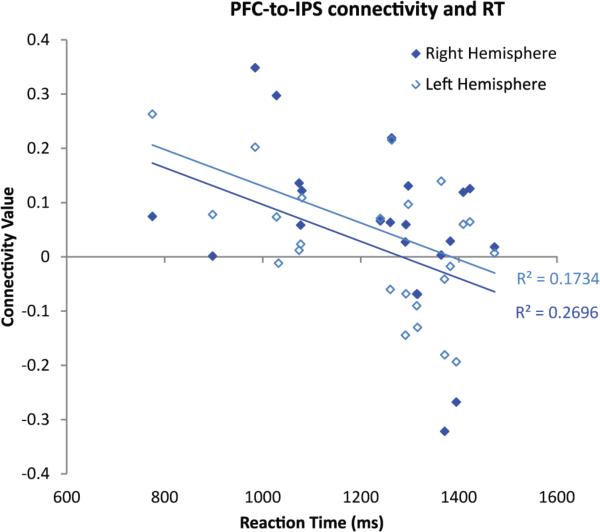
Ipsilateral fronto-parietal connectivity was correlated with better performance (faster reaction time) on the formal number matching task (matching Arabic numerals to arrays of dots) in children. Right fronto-parietal connectivity (Mean correlation among children: N= 24, r= -.42, p<.05) and left fronto-parietal connectivity (N = 24, r=-.52, p<.01) were both negatively correlated with number task RT, meaning kids who had stronger connectivity values were faster at matching dot arrays to their respective Arabic numerals. This analysis is shown in Figure 7a. Importantly, right fronto-parietal connectivity was correlated with number task RT but not overall task RT (r= -.21, p=.31).
Figure 7a.
Individual PFC-IPS connectivity r values in each hemisphere for each child are plotted against their reaction time in the number matching task, showing a significant negative correlation.
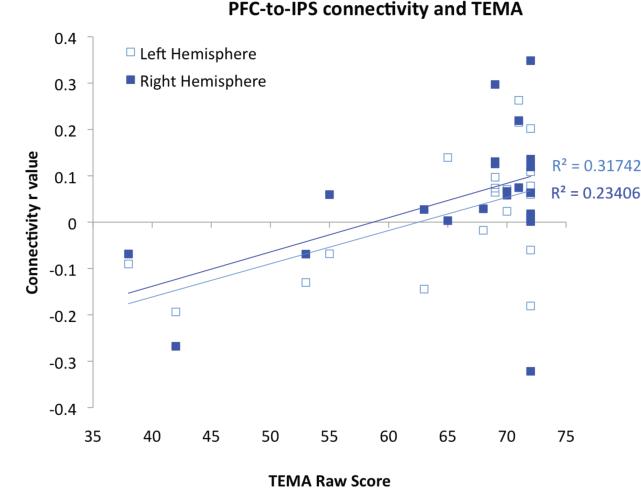
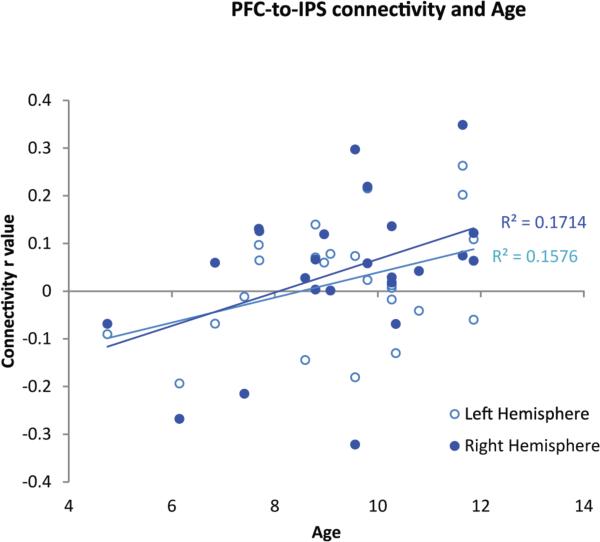
Fronto-parietal connectivity strength was also significantly correlated with children's performance on the TEMA math IQ assessment in both hemispheres (Figure 7b; right: N = 22, r = . 48, p=.011; left: N = 22, r= .56, p=.003) Thus overall, performance on the TEMA predicted the functional connectivity of our number-selective PFC and IPS regions during free-viewing of the educational video. In addition to this correlation between functional connectivity in the fronto-parietal network and TEMA math IQ, we also found a correlation with age (N= 24, r=.41, p=.023). The correlation between age and fronto-parietal functional connectivity is shown in Figure 7c. It is important to note that the age-connectivity correlation was weaker than the correlation between TEMA score and connectivity.
Figure 7b.
Individual PFC-IPS connectivity r values in each hemisphere for each child are plotted against their raw score on the TEMA-3, showing a significant positive correlation.
Figure 7c.
Individual PFC-IPS connectivity r values in each hemisphere for each child are plotted against age, showing a significant positive correlation.
To determine whether the functional connectivity correlation with TEMA score was specific to mathematical intelligence and not due to the maturation intelligence more broadly, we calculated partial correlations of TEMA score and connectivity strength, controlling for children's score on the K-BIT test of verbal intelligence. When controlling for verbal intelligence in a partial correlation, children's right fronto-parietal connectivity was still significantly correlated with their mathematics ability (N=22, r = .69, p=.0002) as was left fronto-parietal connectivity (N=22, r=.52, p=.014). Each of these correlations survives Holm-Bonferroni correction at .05 (corrected to α =.016 for three comparisons). Therefore, the fronto-parietal connectivity that we have observed is not equally related to verbal and mathematical intelligence. Instead, the functional connectivity between the fronto-parietal regions that engage in numerical processing is at least somewhat specialized for math development.
A stepwise regression with left fronto-parietal functional connectivity as the dependent variable and Age, TEMA score, KBIT-verbal score, Numerical Matching RT, and Numerical Matching Accuracy as predictors settled on a final model that included only TEMA score and Numerical Matching RT (Model R2=.461, F(1,21)=8.13, p < .005; TEMA Beta = .44, Number RT Beta = -.40, p's < .05; all other Betas have p's > .25). The same variables were tested for right fronto-parietal connectivity and the final model included only TEMA score (Model R2=.48, F(1,21)=6.11, p < .05; TEMA Beta = .48; all other Betas have p's > .16). Thus, numerical matching performance and mathematics test scores are the primary correlates of the observed fronto-parietal connectivity.
3.4 Control Analysis: Motion
Some evidence indicates that head motion can correlate with functional connectivity strength in some brain networks (Van Dijk, Sabuncu, & Buckner, 2012). We found that motion was not a significant predictor of functional connectivity in our stepwise regression (left hemisphere: Translation Beta = -.28, Rotation Beta = -.30; right hemisphere: Translation Beta = -.19, Rotation Beta = -.22). Instead, as in the previous section, only mathematics performance (TEMA and Numerical Matching RT) predicted functional connectivity in number-related brain regions (left hemisphere: Model R2=.56, F(1,21)=8.13, p < .005; TEMA Beta = .44; Number RT Beta = -.40, all other Betas p > .14; right hemisphere: Model R2=.48, F(1,21)=6.11, p < .05; TEMA Beta = .48, all other betas p > .16).
3.5 Control Analysis: Face Network
In a parallel analysis, we localized face-selective regions with the contrast Faces > Number, Words, & Shapes on data from the fMRI matching task. We then tested connectivity between the ventral prefrontal and fusiform regions that emerged from that contrast. We found no correlation between the functional connectivity of this network and children's math performance.
Fronto-parietal connectivity strength in the face network was not correlated with children's performance on the TEMA math test (N = 22, r = -0.06, p=.79). This correlation between face network connectivity and TEMA score is significantly lower than the correlation between number network connectivity and TEMA score (Fisher transform, one-tailed, N=22, left: r = 0.48 vs. -0.06, p < .05; right: r=0.56 vs. -0.06, p < .05). We also found no correlation with age (N= 24, r=.02, p=.92). Connectivity was not significantly correlated with RT on the number matching task (N = 24, r=-.21, p=.32). However, face network connectivity was negatively correlated with RT in the face task (N = 24, r=-.52, p<.01). Children who had stronger fronto-fusiform connectivity values were faster at matching faces (not numbers).
3.6 Control Analysis: Reaction Time
We analyzed the fMRI data collected from children during the matching task to localize regions that respond based on the duration of response times, independently of task content. The model included the duration of children's response times as a regressor across all conditions (faces, numbers, words, and shapes). We tested the contrast of RT-modulation versus baseline (fixation). The analysis revealed RT-modulated regions in frontal and parietal cortices. Peak activation loci are labeled in Figure 4. Table 1 shows coordinates of all activation sites. The pattern of fronto-parietal activations in children are similar to previously reported studies of response inhibition, interference suppression, cognitive set shifting, and other domain-general task processes that are related to cognitive control (Bunge et al. 2002; Casey et al. 1997; Konishi et al. 1999; Rubia et al. 2001).
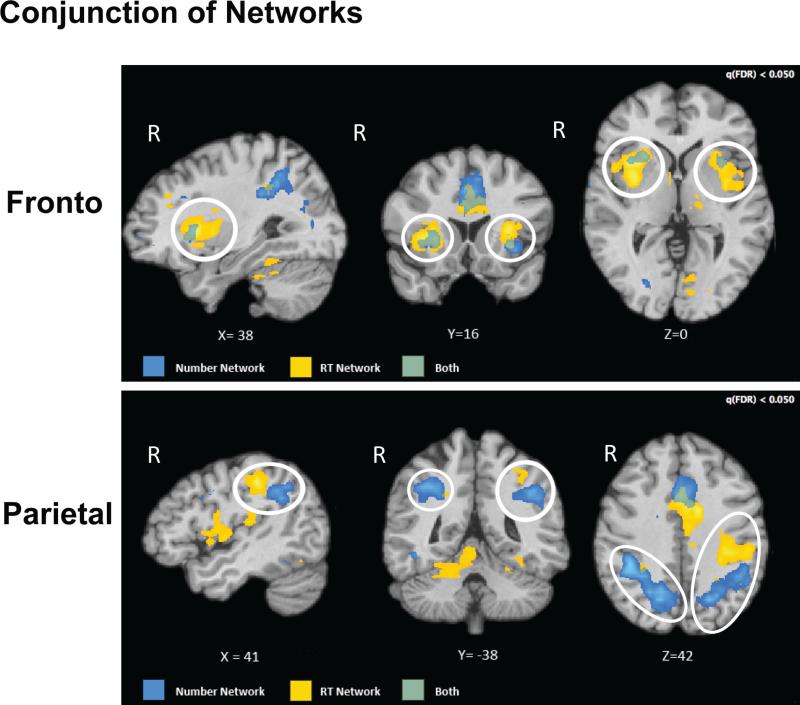
Figure 8 shows a map of the RT-related frontal and parietal regions compared to the frontal and parietal regions that were number-selective. The figure shows that the frontal regions overlap considerably but the parietal regions do not. This indicates that our PFC regions might be globally involved in resolving task difficulty but the IPS regions are more number-selective. We tested RT-related BOLD amplitude in the number-related ROIs from the localizer task to determine whether our math effects are related to global RT. Children's scores on the TEMA did not correlated with the RT-related BOLD amplitudes in number-related regions of the right IPS (r=-0.04, p=.85), left IPS (r=-0.22, p=.30), right PFC (r=0.24, p=.25), or left PFC (r=0.10, p=.64).
Figure 8.
Overlap between the Number-related network and the RT-modulated network in the frontal and parietal cortices. Blue indicates number-related regions; yellow indicates RT-related regions; and green indicates their overlap.
4. Discussion
Our results indicate that the observed fronto-parietal network is important for numerical development not only during isolated numerical tasks (i.e., number matching) but it is also related to the real world mathematical skills that comprise the TEMA IQ test. As evidenced by our data, the relationship between fronto-parietal connectivity and math performance is meaningfully captured by a natural viewing paradigm: this is one of our first demonstrations that neural activity during natural viewing is related to behavior in children (see also Cantlon & Li, in review). Our study used Sesame Street viewing as the natural viewing paradigm. Natural viewing paradigms are interesting because they offer the opportunity for increased ecological validity in developmental neuroimaging experiments. The data from this natural viewing paradigm show that the correlation between frontal and parietal activity during Sesame Street viewing statistically predicts children's math performance and therefore likely plays a role in formal mathematics development.
The children in our study performed as well as adults on the Arabic numerals-to-dot arrays matching task. This finding is partly due to the fact that we excluded children who performed at or below chance from our sample. We excluded those children in order to remove data from subjects who did not meaningfully attempt to perform the experimental tasks. Under these conditions, we found that the amplitude of number-related responses does not differ between children and adults in frontal or parietal regions. That finding is consistent with prior research showing equal levels of frontal activation with equal performance between children and adults (Brown et al 2005). Yet, despite equivalence in BOLD amplitude, the functional connectivity between frontal and parietal regions differed between age groups: adults exhibited greater fronto-parietal connectivity than children. This finding points to the conclusion that amplitude and connectivity are dissociable markers of development. Given equal performance, children show equal response amplitude to adults but reduced fronto-parietal connectivity strength. Fronto-parietal connectivity strength in children is predicted by children's age, number matching RT, and math IQ. In our analysis, number matching performance and mathematics IQ scores were the strongest statistical predictors of children's fronto-parietal connectivity.
The precise role of fronto-parietal connectivity in mathematics development is not transparent. Previous hypotheses about the nature of activation in the fronto-parietal network have alluded to the role of connectivity between these regions in the development of abstract numerical concepts (Ansari & Dhital 2006; Ansari et al 2005; Cantlon et al 2009; Nieder 2009; Rivera et al 2005). One recent study found greater fronto-parietal functional connectivity in 8-9 year old children compared to 7-8 year old children during an arithmetic task (Rosenberg-Lee, Barth, and Menon, in press). They suggest that the fronto-parietal network is involved in the development of problem solving skills in children. Our study elaborates that prior result by showing that fronto-parietal connectivity predicts children's performance on standardized mathematical tests. And, we show that this relation holds even when controlling for standardized verbal intelligence scores. Moreover, we found that children and adults exhibit age-related differences in number-related fronto-parietal connectivity even when numerical task performance and number-related BOLD amplitude is similarly high across the two age groups. These three pieces of information indicate that the correlation between fronto-parietal connectivity and math IQ is not related to differences in generic performance factors between age groups and, in fact, number-related fronto-parietal connectivity exhibits specificity for mathematics processing.
Our results are further strengthened by the finding that face-related activation does not correlate with mathematics performance. Instead, functional connectivity in the fronto-fusiform face-related network correlated with performance on face matching. This result is consistent with our claim that the number-related network is specialized for mathematical processing.
As described in the Introduction, there are several hypotheses about the cognitive work that fronto-parietal connectivity contributes to mathematical processing. A previous hypothesis from non-human primate neurophysiology studies (Nieder 2009; Nieder & Merten 2007), claimed that connectivity between the frontal and parietal networks might represent the ability to associate non-symbolic numerical representations with their symbolic counterparts (Cantlon et al., 2009). That hypothesis could explain why the fronto-parietal network appears significantly stronger for numbers than any other category in our matching task. However, if this fronto-parietal connection is primarily involved in associating number symbols to numerical values, one might expect to see stronger connectivity in children compared to adults because children are still solidifying associations between Arabic numerals and their semantic values. Our study cannot fully address that issue because the children in our study performed at adult-like levels on our symbolic-to-nonsymbolic numerical matching task. Nonetheless, fronto-parietal connectivity increased with age, math IQ, and RT in our study, which is the opposite pattern that would be predicted by that hypothesis. This finding indicates that this instance of fronto-parietal connectivity continues to develop beyond the point when children map symbols to numerical values. Therefore, the role of fronto-parietal connectivity in mathematical development is not limited to learning symbolic numbers (although it could still be an important parameter for predicting number symbol learning in children who are less proficient with numerals).
Another previous hypothesis is that a greater fronto-parietal connectivity is driven by more efficient use of the general resources of the frontal network, such as working memory and attentional control. Rivera et al (2005), argued that the efficient use of working memory, attention, and other executive control functions results in higher success on math-related tasks and therefore, more efficient use of the fronto-parietal network. However, this type of hypothesis does not fit our data for two reasons. The first is that the regions we identified in the localizer task responded more strongly during the number task than the face-, shape-, or word-matching task despite the fact that performance was relatively equivalent across these conditions for children. The behavioral data indicated that our number task did not require more general cognitive resources than the other three conditions. Secondly, the correlation that we observed between math IQ and fronto-parietal connectivity remained strong when we regressed out verbal IQ. These two findings suggest that the patterns of neural activity that we observed in children are related at least somewhat specifically to numerical processing, rather than global changes in domain-general task factors. However, since children were slower but equally accurate to adults on the numerical task, it could be the case that they require more math-specific effort to attain similar numerical performance levels to adults. Fronto-parietal connectivity strength could be related to math-specific changes in working memory, attention, or cognitive control.
The PFC region of our fronto-parietal network likely plays a more general role in cognitive processing beyond the math-related function it appears to serve in this task. The control data show that number-related PFC regions overlap with PFC regions that are generally modulated by RT. This means that the PFC number-selective regions are not likely involved exclusively in numerical processing and instead have a more general function. Proximal PFC regions have been shown to play a role in executive control and active maintenance of information (Cohen et al., 1997). On the other hand, number-selective IPS regions did not overlap with parietal regions that were generally modulated by RT, indicating that number-related activations in these parietal regions cannot be explained by general effort to resolve task difficulty. Thus despite the fact that the functional intersection (i.e., the connectivity) between the number-selective PFC and IPS regions is math-specific, the frontal and parietal regions involved are not equally math-selective on their own. Here, the IPS exhibits a more robust profile of number-selectivity than the PFC region.
It is important to emphasize that both executive functions and domain-specific numerical processes are likely factors in our correlations with mathematics performance. The weight that each of these cognitive functions contributes to our correlation is unknown. We have ruled out general factors such as general intelligence and overall RT as all-encompassing predictors of our number- and math-related effects. However, we have not positively assessed the contribution of executive functioning relative to domain-specific numerical processing in our assays. That is an important next step for understanding mathematics development in the brain.
Performance-dependent increases in fronto-parietal connectivity might be a general feature of functional brain development that characterizes many cognitive tasks, but the specific sub-regions of frontal and parietal cortices that intersect could vary depending on task content (Casey et al. 2005; Zagy et al. 2004). Evidence from previous studies shows that neural activity becomes more focal or fine-tuned over development (Brown et al 2005; Durston et al 2006) and is hypothesized to reflect the refinement of networks as knowledge is acquired (Brown et al 2005; Bunge et al 2002; Casey et al 2005; Durston et al 2006; Schlaggar et al 2002, Zagy et al. 2004). In the context of these research studies, our data implicate the hypothesis that developmental changes in fronto-parietal connectivity reflect the intersection of a subset of executive functions and semantic representations, which in this case include numerical values and mathematical operations. We predict that the specific content of a task, whether numbers, words, faces, tools, etc., will yield different developmental patterns of functional connectivity between the frontal and category-selective cortex.
5. Conclusions
Our results indicate that the functional connectivity of a fronto-parietal network predicts mathematical development. The strength of children's fronto-parietal functional connectivity selectively correlates with their basic numerical matching skill as well as their math IQ. Importantly, the relationship between this case of fronto-parietal connectivity and mathematics skill is domain-specific in the sense that it is independent of children's verbal skills, overall RT, and age. Fronto-parietal connectivity also uniquely correlates with math development compared to other functionally connected networks (i.e., a face processing network). Together these findings support the notion that number-related fronto-parietal functional connectivity is a domain-specific marker of mathematics development. With further research, such measures of connectivity could be used as a biomarker to evaluate the interplay between domain-specific and domain-general faculties in mathematics learning. If fronto-parietal connectivity is determined to have a causal role in mathematics learning, it could be a valuable diagnostic tool for the field of education.
Highlights for.
- We used fMRI to identify a fronto-parietal network of number-related brain regions in children.
- We measured the functional connectivity of this network while children watched educational television (Sesame Street).
- Fronto-parietal connectivity correlated with children's age, number-matching ability, and standardized math test scores.
- Children's scores on a standardized math test are predicted by fronto-parietal connectivity, independent of verbal intelligence.
Footnotes
Publisher's Disclaimer: This is a PDF file of an unedited manuscript that has been accepted for publication. As a service to our customers we are providing this early version of the manuscript. The manuscript will undergo copyediting, typesetting, and review of the resulting proof before it is published in its final citable form. Please note that during the production process errors may be discovered which could affect the content, and all legal disclaimers that apply to the journal pertain.
References
- Ansari D, Dhital B. Age-related changes in the activation of the intraparietal sulcus during nonsymbolic magnitude processing: an event-related functional magnetic resonance imaging study. J Cogn Neurosci. 2006;18:1820–8. doi: 10.1162/jocn.2006.18.11.1820. [DOI] [PubMed] [Google Scholar]
- Ansari D, Garcia N, Lucas E, Hamon K, Dhital B. Neural correlates of symbolic number processing in children and adults. Neuroreport. 2005;16:1769–73. doi: 10.1097/01.wnr.0000183905.23396.f1. [DOI] [PubMed] [Google Scholar]
- Brown TT, Lugar HM, Coalson RS, Miezin FM, Petersen SE, Schlaggar BL. Developmental changes in human cerebral functional organization for word generation. Cereb Cortex. 2005;15:275–90. doi: 10.1093/cercor/bhh129. [DOI] [PubMed] [Google Scholar]
- Bunge SA, Dudukovic NM, Thomason ME, Vaidya CJ, Gabrieli JD. Immature frontal lobe contributions to cognitive control in children: evidence from fMRI. Neuron. 2002;33:301–11. doi: 10.1016/s0896-6273(01)00583-9. [DOI] [PMC free article] [PubMed] [Google Scholar]
- Cantlon JF, Li R. Children's Test Scores Correlate with their Neural Responses during Natural Viewing of Sesame Street.
- Cantlon JF, Brannon EM, Carter EJ, Pelphrey KA. Functional imaging of numerical processing in adults and 4-y-old children. PLoS Biol. 2006;4:e125. doi: 10.1371/journal.pbio.0040125. [DOI] [PMC free article] [PubMed] [Google Scholar]
- Cantlon JF, Libertus ME, Pinel P, Dehaene S, Brannon EM, Pelphrey KA. The neural development of an abstract concept of number. J Cogn Neurosci. 2009;21:2217–29. doi: 10.1162/jocn.2008.21159. [DOI] [PMC free article] [PubMed] [Google Scholar]
- Casey BJ, Trainor RJ, Orendi JL, Nystrom LE, Giedd JN, Castellanos FX, Haxby JV, Noll DC, Cohen JD, Forman SD, et al. A developmental functional MRI study of prefrontal activation during performance of a Go-No-Go task. J. Cogn. Neu- rosci. 1997;9:835–847. doi: 10.1162/jocn.1997.9.6.835. [DOI] [PubMed] [Google Scholar]
- Casey BJ, Galvan A, Hare TA. Changes in cerebral functional organization during cognitive development. Curr Opin Neurobiol. 2005;15:239–44. doi: 10.1016/j.conb.2005.03.012. [DOI] [PubMed] [Google Scholar]
- Cohen J, Perlstein W, Braver T, Nystrom L, Noll D, Jonides J, et al. Temporal dynamics of brain activation during a working memory task. Nature. 1997;386:604–608. doi: 10.1038/386604a0. [DOI] [PubMed] [Google Scholar]
- Dehaene S, Dehaene-Lambertz G, Cohen L. Abstract representations of numbers in the animal and human brain. Trends Neurosci. 1998;21:355–61. doi: 10.1016/s0166-2236(98)01263-6. [DOI] [PubMed] [Google Scholar]
- Dehaene S, Piazza M, Pinel P, Cohen L. Three parietal circuits for number processing. Cogn Neuropsychol. 2003;20:487–506. doi: 10.1080/02643290244000239. [DOI] [PubMed] [Google Scholar]
- Durston S, Davidson MC, Tottenham N, Galvan A, Spicer J. A shift from diffuse to focal cortical activity with development. Dev Sci. 2006;9:1–8. doi: 10.1111/j.1467-7687.2005.00454.x. [DOI] [PubMed] [Google Scholar]
- Eger E, Sterzer P, Russ MO, Giraud AL, Kleinschmidt A. A supramodal number representation in human intraparietal cortex. Neuron. 2003;37:719–25. doi: 10.1016/s0896-6273(03)00036-9. [DOI] [PubMed] [Google Scholar]
- Friston KJ, Frith CD, Liddle PF, Frackowiak RS. Functional connectivity: the principal-component analysis of large (PET) data sets. J Cereb Blood Flow Metab. 1993;13:5–14. doi: 10.1038/jcbfm.1993.4. [DOI] [PubMed] [Google Scholar]
- Fox MD, Snyder AZ, Vincent JL, Corbetta M, Van Essen DC, Raichle ME. The human brain is intrinsically organized into dynamic, anticorrelated functional network. Proc Natl Acad Sci USA. 2005;106:17558–63. doi: 10.1073/pnas.0504136102. [DOI] [PMC free article] [PubMed] [Google Scholar]
- Ginsburg HP. Test of Early Mathematics Ability. Third Edition Pro-Ed; Austin, TX: 2003. [Google Scholar]
- Goebel R, Esposito F, Formisano E. Analysis of FIAC data with BrainVoyager QX: From single-subject to cortically aligned group GLM analysis and self-organizing group ICA. Human Brain Mapping. 2006;27(5):392–401. doi: 10.1002/hbm.20249. [DOI] [PMC free article] [PubMed] [Google Scholar]
- Halberda J, Mazzocco MM, Feigenson L. Individual differences in non-verbal number acuity correlate with maths achievement. Nature. 2008;455:665–8. doi: 10.1038/nature07246. [DOI] [PubMed] [Google Scholar]
- Hampson M, Tokoglu F, Sun Z, Schafer RJ, Skudlarski P. Connectivity-behavior analysis reveals that functional connectivity between left BA39 and Broca's area varies with reading ability. Neuroimage. 2006;31:513–519. doi: 10.1016/j.neuroimage.2005.12.040. [DOI] [PubMed] [Google Scholar]
- Hasson U, Nir Y, Levy I, Fuhrmann G, Malach R. Intersubject synchronization of cortical activity during natural vision. Science. 2004;303:1634–1640. doi: 10.1126/science.1089506. [DOI] [PubMed] [Google Scholar]
- Holloway ID, Ansari D. Developmental specialization in the right intraparietal sulcus for the abstract representation of numerical magnitude. J Cogn Neurosci. 2010;22:2627–37. doi: 10.1162/jocn.2009.21399. [DOI] [PubMed] [Google Scholar]
- Kaufman AS. Kaufman Brief Intelligence Test. 2nd Edition. American Guidance Service; Circle Pines, MN: 2004. [Google Scholar]
- Konishi S, Nakajima K, Uchida I, Kikyo H, Kameyama M, Miyashita Y. Common inhibitory mechanism in human infe- rior prefrontal cortex revealed by event-related functional MRI. Brain. 1999;122:981–991. doi: 10.1093/brain/122.5.981. [DOI] [PubMed] [Google Scholar]
- Lewis CM, Baldassarre A, Committeri G, Romani GL, Corbetta M. Learning sculpts the spontaneous activity of the resting human brain. Proc Natl Acad Sci U S A. 2009;106:17558–63. doi: 10.1073/pnas.0902455106. [DOI] [PMC free article] [PubMed] [Google Scholar]
- Lipton JS, Spelke ES. Preschool children's mapping of number words to nonsymbolic numerosities. Child Dev. 2005;76:978–88. doi: 10.1111/j.1467-8624.2005.00891.x. [DOI] [PubMed] [Google Scholar]
- Nieder A. Prefrontal cortex and the evolution of symbolic reference. Curr Opin Neurobiol. 2009;19:99–108. doi: 10.1016/j.conb.2009.04.008. [DOI] [PubMed] [Google Scholar]
- Nieder A, Freedman DJ, Miller EK. Representation of the quantity of visual items in the primate prefrontal cortex. Science. 2002;297:1708–11. doi: 10.1126/science.1072493. [DOI] [PubMed] [Google Scholar]
- Nieder A, Merten K. A labeled-line code for small and large numerosities in the monkey prefrontal cortex. J Neurosci. 2007;27:5986–93. doi: 10.1523/JNEUROSCI.1056-07.2007. [DOI] [PMC free article] [PubMed] [Google Scholar]
- Piazza M, Izard V, Pinel P, Le Bihan D, Dehaene S. Tuning curves for approximate numerosity in the human intraparietal sulcus. Neuron. 2004;44:547–55. doi: 10.1016/j.neuron.2004.10.014. [DOI] [PubMed] [Google Scholar]
- Piazza M, Pinel P, Le Bihan D, Dehaene S. A magnitude code common to numerosities and number symbols in human intraparietal cortex. Neuron. 2007;53:293–305. doi: 10.1016/j.neuron.2006.11.022. [DOI] [PubMed] [Google Scholar]
- Rivera SM, Reiss AL, Eckert MA, Menon V. Developmental changes in mental arithmetic: evidence for increased functional specialization in the left inferior parietal cortex. Cereb Cortex. 2005;15:1779–90. doi: 10.1093/cercor/bhi055. [DOI] [PubMed] [Google Scholar]
- Rubia K, Russell T, Overmeyer S, Brammer MJ, Bullmore ET, Sharma T, Simmons A, Williams SC, Giampietro V, Andrew CM, Taylor E. Mapping motor inhibition: conjunctive brain activations across different versions of go/no-go and stop tasks. Neuroimage. 2001;13:250–261. doi: 10.1006/nimg.2000.0685. [DOI] [PubMed] [Google Scholar]
- Schlaggar BL, Brown TT, Lugar HM, Visscher KM, Miezin FM, Petersen SE. Functional neuroanatomical differences between adults and school-age children in the processing of single words. Science. 2002;296:1476–9. doi: 10.1126/science.1069464. [DOI] [PubMed] [Google Scholar]
- Talairach J. Co-planar Stereotaxic Atlas of the Human Brain 3-Dimensional Proportional System: An Approach to Cerebral Imaging. Stuttgart; New York: 1988. [Google Scholar]
- Van Dijk KR, Hedden T, Venkataraman A, Evans KC, Lazar SW, Buckner RL. Intrinsic functional connectivity as a tool for human connectomics: theory, properties, and optimization. J Neurophysiol. 2010;103:297–321. doi: 10.1152/jn.00783.2009. [DOI] [PMC free article] [PubMed] [Google Scholar]
- Van Dijk KR, Sabuncu MR, Buckner RL. The influence of head motion on intrinsic functional connectivity MRI. Neuroimage. 2012;59:1, 431–438. doi: 10.1016/j.neuroimage.2011.07.044. [DOI] [PMC free article] [PubMed] [Google Scholar]
- Nagy Z, Westerberg H, Klingberg T. Maturation of white matter is associated with the development of cognitive functions during childhood. J Cogn Neurosci. 2004;16:1227–1233. doi: 10.1162/0898929041920441. [DOI] [PubMed] [Google Scholar]


