
Figure 3.
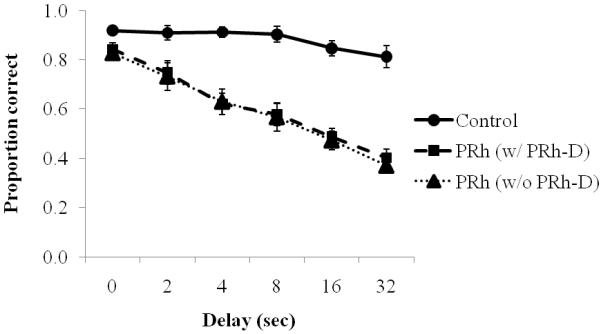
Average matching-to-sample performance with different delays in control monkeys (n = 4; solid line) and monkeys from which perirhinal cortex was removed bilaterally, with all PRh monkeys (n = 6) and with PRh-D excluded (n = 5; dashed line). Error bars indicate standard errors.