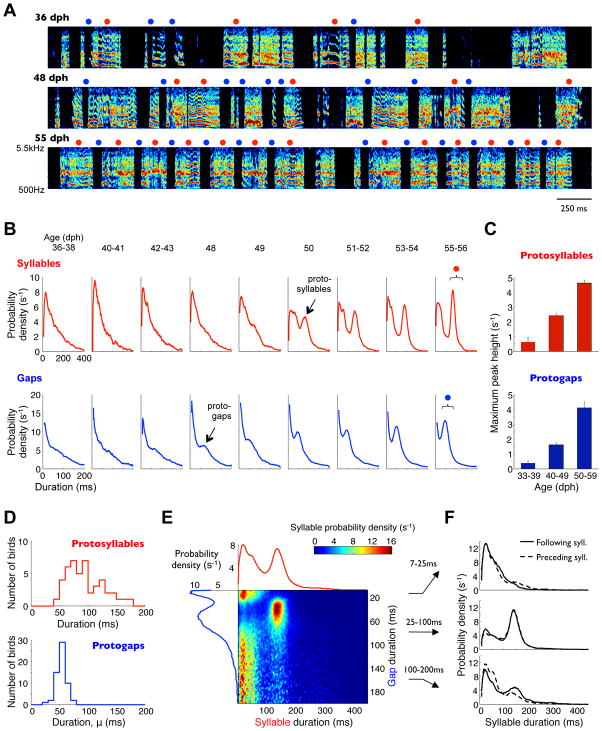
Figure 5.
Early song development is characterized by appearance of consistent timing. (a) Spectrograms of songs produced by one bird at three developmental stages. Red circles: syllables 140–240 ms long. Blue circles: gaps 30–90 ms long. (b) Developmental progression of syllable and gap duration distributions from the same bird. Brackets indicate duration ranges marked above (red and blue circles). (c) Heights of peaks in syllable and gap duration distributions (corresponding to protosyllables and protogaps), quantified across all birds. Bars indicate median values across birds in a given age group; error bars are bootstrap standard errors of the median. (d) Distributions of protosyllable and protogap durations across all birds. (e) Probability distribution of all consecutive syllable and gap durations in an early plastic-song bird. Each row of the color-coded matrix is individually normalized to a sum of 1, such that values indicate syllable durations conditional on gap duration. Also shown are the overall gap duration distribution (blue trace, left) and syllable duration distribution (red trace, top). (f) Duration distributions of syllables that precede and follow gaps of three different duration ranges. Protogaps and protosyllables tend to follow each other.

