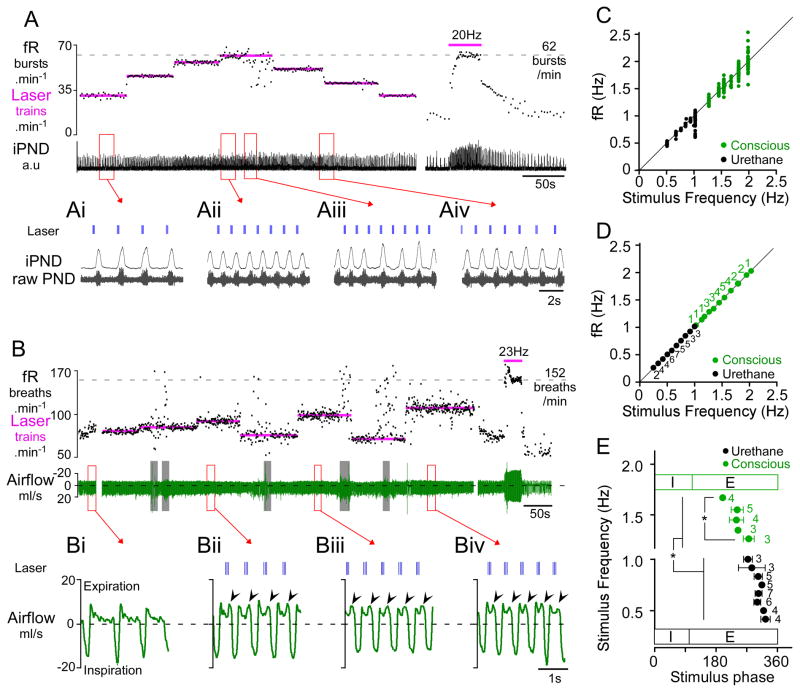
Figure 2. Respiratory pacing by intermittent photostimulation of RTN neurons in anesthetized and conscious rats.
A) Urethane-anesthetized rat. Photostimulus trains (4 × 20 ms pulses at 20 Hz) entrained PND over a range of 32 breaths.min−1 (from 25–60 bursts.min−1; see also excerpts Ai, Aii). The maximal fR observed in this rat during continuous RTN stimulation at 20 Hz was 62 bursts.min−1 (at right in panel A). At low frequencies (Ai), the laser trains settled in late expiration, whereas at higher frequencies, the stimulus train settled earlier during the expiratory phase (Aii). RTN stimulation at 60 trains.min−1 caused arrhythmia (excerpt Aiii). Aiv shows that fR follows the transition from one stimulus frequency to the next (50 to 40 trains.min−1). B) Conscious quiet rat. Light pulses (3 × 3 ms pulses at 20 Hz) entrained fR in the range of 75–120 breaths.min−1. Resting fR was close to 60 min−1 in this rat and the maximum fR seen in presence of high CO2 was 152 breaths.min−1. Continuous high frequency stimulation (23 Hz, 3 ms, at right in panel B) produced a more robust activation of breathing than short bursts. Grey bars indicate periods of behavioral artifacts (e.g sniffing, movement). Bi–Biv excerpts from panel B showing expanded plethysmography traces at various entrainment frequencies. Bi: quiet breathing in the absence of stimulation. Note monophasic decay of airflow during expiration consistent with passive lung recoil. Bii–Biv: airflow traces at three different pacing frequencies. Expiratory flow becomes biphasic with pronounced increase in flow during late expiration (arrows), indicative of active expiration. Note that the stimulation trains settle in mid-expiration during entrainment. C) Relationship between stimulus train frequency and fR for the rats shown in A (anesthetized-black) or B (conscious-green). The instantaneous frequency of each burst/breath is plotted against the frequency of the light trains. Note the increased variability of fR at higher entrainment frequencies, reflecting poor entrainment. D) Group data showing the reliability of entrainment at a range of stimulus frequencies in anesthetized (N=7) and conscious (N=6) animals. Each point represents the average fR (± SEM) when entrainment was successful. Adjacent numbers indicate the number of animals that were successfully entrained at a given stimulation frequency. Every frequency was not tested in every animal hence the varying number of determinations for each tested frequency. E) Relationship between the stimulus train frequency and the phase angle of the stimulus train during successful entrainment of the breathing cycle. Note that as stimulus (and entrainment) frequency increased, the phase angle of the stimulus train decreased. In conscious animals, the stimulus occurred at a significantly earlier phase in the respiratory cycle than in anesthetized rats. (* P<0.05).

