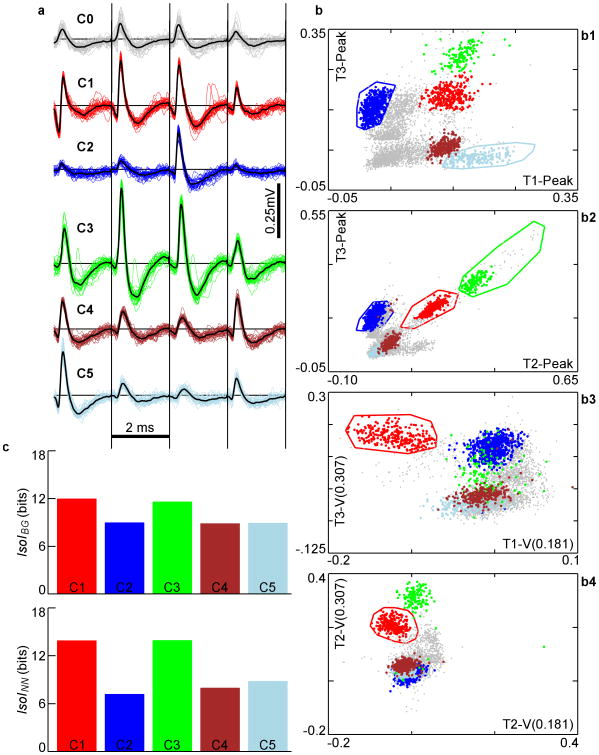
Figure 1.
a. Extracellular action potential waveforms (negative up) of 5 well-defined clusters, C1-C5. Gray waveforms (C0) are un-clustered spikes. The 4 signals recorded from each wire of the tetrode (T1-T4) are drawn next to each other, separated by vertical black lines. Waveforms were stored 250 μs before the upward threshold crossing and 1.75 ms afterwards. b. Different 2-D slices of the clusters in feature-space. T1-Peak is defined as the peak voltage on wire 1 (see methods). T1-V(0.181) is a user-defined feature defined as the voltage on wire 1 at time 181 μs of the stored waveform. T3-V(0.307) is the voltage on wire 3 at 307 μs. These features were selected by an expert user to optimize waveform isolation, as reflected in the well-separated clusters. Only the 5 best clusters found are highlighted here. Voltage in units of mV. c. Top – IsoIBG of the 5 clusters shown in b. Bottom – IsoINN of the 5 clusters.

