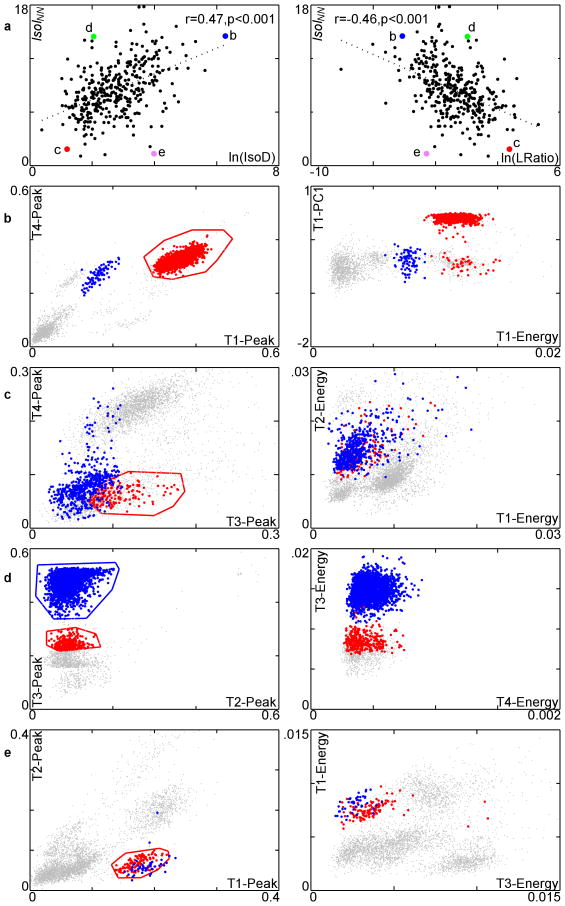
Figure 5.
Comparison of IsoINN and ln(IsoD), ln(LRatio) on all clusters in the dataset along with several case studies. a. Plot of IsoINN vs. ln(IsoD) and ln(LRatio). Larger, labeled points represent clusters discussed in text. These clusters are shown in parts b-e. b-e. The red cluster is the cluster of interest, and the blue is its nearest-neighboring cluster. The gray points are the remaining unassigned spikes. The left column of b-e shows the slices of the feature space used by IsoINN, and the right column shows slices of the feature-space used by IsoD. Voltage in units of mV. b. A well-isolated cluster according to both measures. c. A poorly-isolated cluster according to both measures. d. A well-isolated cluster from its nearest-neighbor cluster, but poorly-isolated from background. This example illustrates that neither IsoD nor LRatio is sensitive to separation between clusters. e. A cluster with poor separation from its nearest-neighbor cluster but good cluster-background separation. The overlap between the red and blue clusters indicates they may need to be merged into a single cluster or discarded.

