Figure 5.
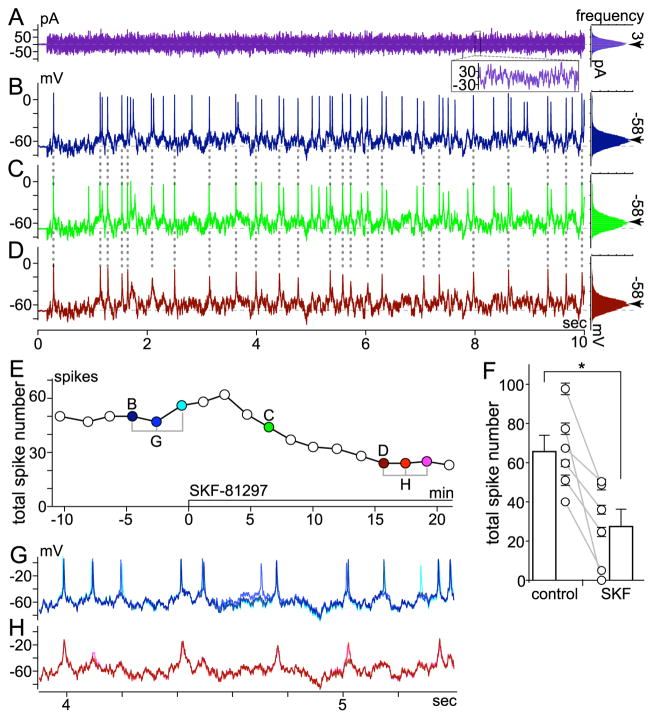
Effect of SKF-81297 on spikes elicited by fluctuating current injection. Voltage-clamp-controlled current-clamp (VCcCC) mode recording at room temperature. Perforated-patch configuration in low Ca2+ bath solution. Spiking elicited by injecting fluctuating current at intervals of at least 20 sec. A, Waveform of current injected (left) and histogram of current amplitude (far right). Traces of current measured at moments labeled “B” and “D” in E, and histograms constructed from these currents, are superimposed in A. Inset superimposes current recorded between 8.0 and 8.1 sec of each 10-sec trace. Traces from B and D plotted in blue and red, respectively. Histograms fit to a Gaussian distribution; mean and standard deviation are approximately 3 pA (indicated by arrow) and 24 pA, respectively. B–D, Spiking and sub-threshold membrane voltage changes induced by current in A, ~4.5 min before (B), ~6.5 min after (C), and ~16 min after (D) SKF-81297 application began (10 μl of a 1-mM stock solution added to 0.9-ml recording bath; see Methods). Histograms of voltages traversed during each fluctuating current injection plotted to right. Mean voltages between and during the fluctuating current injections were set to −68 mV (dashed horizontal line through voltage traces) and −58 mV (at arrow next to each histogram), respectively. E, Timecourse of SKF-81297 effect on total spike number. Each point plots total number of spikes elicited by 10-sec injection of fluctuating current (e.g., those in B–D are plotted in E at times labeled B, C, and D, respectively). F, mean±SEM of number of spikes recorded during three injections of the current shown in A before and during the response to SFK-81297 in all cells tested (n=6). Lines join the control and SKF values for individual cells. Bars plot the mean±SEM of the values from all cells. The means differed significantly (P<0.009, paired t-test). G–H, Membrane voltage changes on expanded time scale. The three traces recorded at times bracketed before SKF-81297 in E are superimposed in G; those recorded at times bracketed during SKF-81297 in E are superimposed in H. The trace and dot colors show when each recording was made and highlight the similarity in spike timing.

