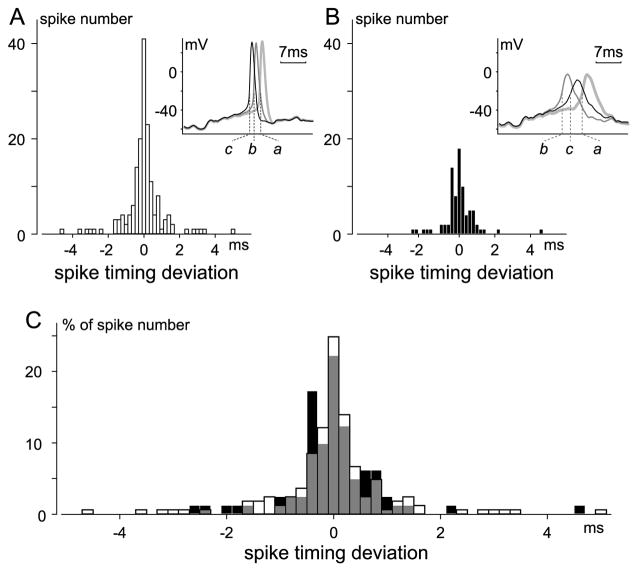
Figure 6.
Spike timing deviation in absence and presence of SKF-81297. Spiking elicited and recorded using same methods as in Fig. 5. Spike timing was compared moment-by-moment in three 10-sec traces recorded ≤ 4 min before application of SKF-81297 (A), and in three 10-sec traces recorded 12–16 min after application of SKF-81297 (B). For each condition, if spikes occurred at similar times in all three traces (i.e., if spikes were “temporally co-aligned”), the difference between the time of each spike and the average of the times of the co-aligned spikes was measured, and tallied accordingly in A or B. Time was measured from beginning of each current injection to moment of maximum change in slope (dV/dt) along rising phase of each spike. Histograms are binned at 0.2 msec, and include 165 (55 × 3) and 81 (27 × 3) spikes for A and B, respectively. Insets superimpose examples of spikes considered to be co-aligned in traces recorded before (A) and after (B) SKF. All 6 traces (labeled a, b, and c in A and in B) begin at identical times after start of each 10-sec current injection. C, Percentage distribution of spike timing deviation. Spike number in A and B was normalized by respective total spike number and the two histograms were overlaid, with gray signifying overlap of the before (clear) and after SKF (filled) distributions.

