Figure 7.
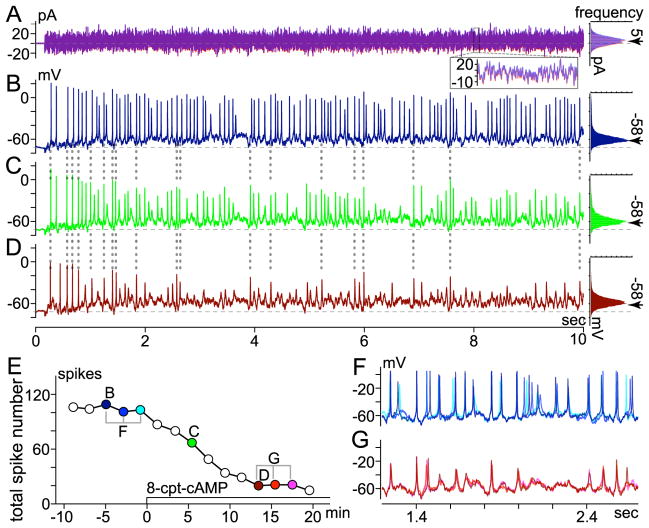
Effect of membrane-permeant cAMP analog (8-cpt-cAMP) on spikes elicited by fluctuating current injection. Recording mode, conditions, and figure format as in Fig. 5. A, Current injected (left) and histogram of current amplitude (right). Left and right parts of A superimpose two traces recorded at B and D in E, and their corresponding amplitude histograms, respectively. Inset superimposes current recorded between 8.0 and 8.1 sec of each 10-sec trace. Histograms fit to a Gaussian distribution with mean and standard deviation of approximately 5 pA (arrow) and 8 pA, respectively. B–D, Spiking and sub-threshold membrane voltage changes induced by current in A, ~5 min before (B), ~5 min after (C), and ~13 min after (D) application of 8-cpt-cAMP began (here, 2 μl of 50 mM stock solution was added to 0.9-ml recording bath). Histograms of voltages traversed during each fluctuating current injection are plotted to right. Mean voltages between and during fluctuating current injections were set to −72 mV (dashed horizontal line through voltage traces) and −58 mV (at arrow next to each histogram), respectively. E, Timecourse of 8-cpt-cAMP effect on total spike number. Each point plots total number of spikes elicited by 10-sec injection of fluctuating current (e.g., those in B–D are plotted at correspondingly labeled times in E). F–G, Membrane voltage on expanded time scale. Three traces recorded at times bracketed before and during 8-cpt-cAMP in E are superimposed in F and G, respectively.

