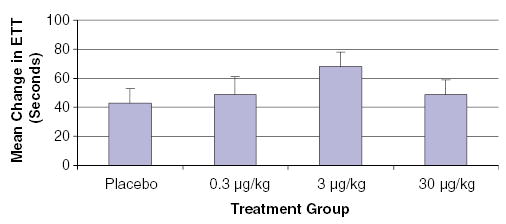
Figure 2.

Mean change in ETT time among all treated groups in the FIRST study of patients with coronary artery disease (Simons et al., 2002). Although there was no significant difference between treatment groups, it is interesting to note that the effect of FGF-2 was highest among patients treated with 3 μg kg−1 and not among patients treated with the highest dose of FGF-2.
