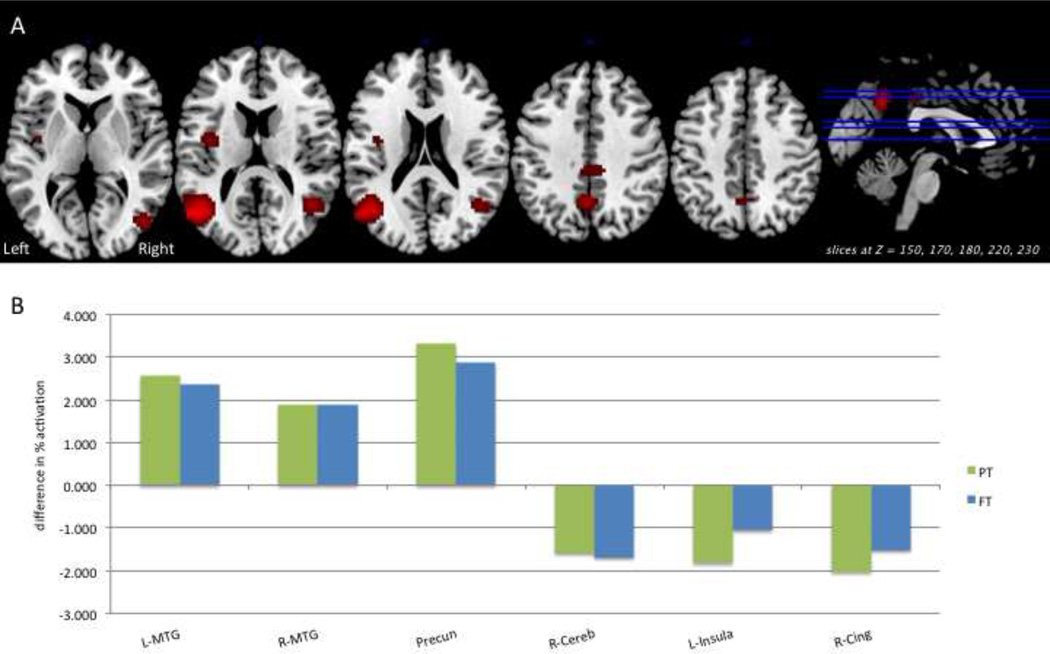
Figure 3.
Significant Verification/Response phase activation related to the group × difficulty interaction (p<0.05 FWE) is shown on relevant axial slices of a group T1 image (Panel A). The difference in percent activation (Difficult – Easy) associated with increased syntactic difficulty for the preterm (green) and full term (blue) groups is shown (Panel B) at each significant cluster from the interaction. Minimum cluster size >10 voxels.

