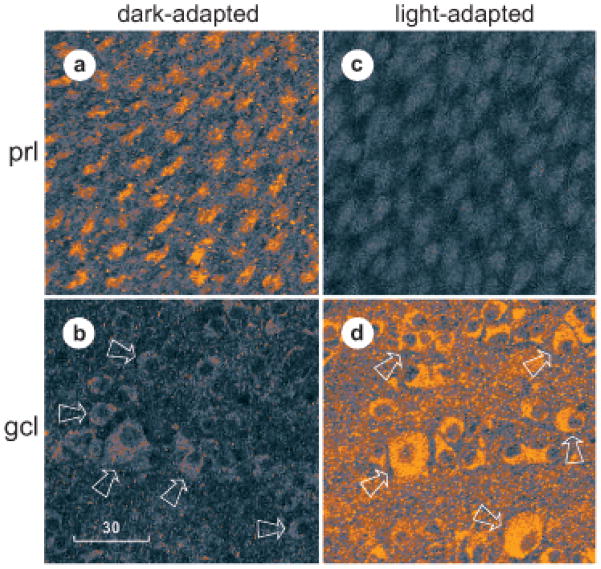
Fig 2.
Optical sections through retina of a fully dark-adapted fish (a, b) that was dissected under infrared illumination at 3 hr after sunset and a lightadapted fish (c, d) that was dissected under room light at 3 hr after sunrise. Each retina was fixed and immunostained as in Figure 1, then viewed in flat-mount at different transretinal levels at fixed lateral coordinates. Plane of section is at level of cone inner segments in photoreceptor layer (prl) in a and c and at level of ganglion cell somata (gcl) in b and d. The intensity of fluorescence that passed through a 590 nm long-pass filter was transformed into CMYK color space in this figure, with the dimmest fluorescence appearing light blue and the brightest fluorescence appearing orange. All sections (a–d) were imaged at identical settings of photomultiplier gain and pinhole diameter. Arrows point to some of the ganglion cell somata in b and d. A curved row of somata can be seen in b, surrounded by the four arrows at the left. Two rows of somata can be seen in d, one between the top pair of arrows and the other between the middle pair of arrows. Magnification is identical in all panels. Scale bar, 30 μm.

