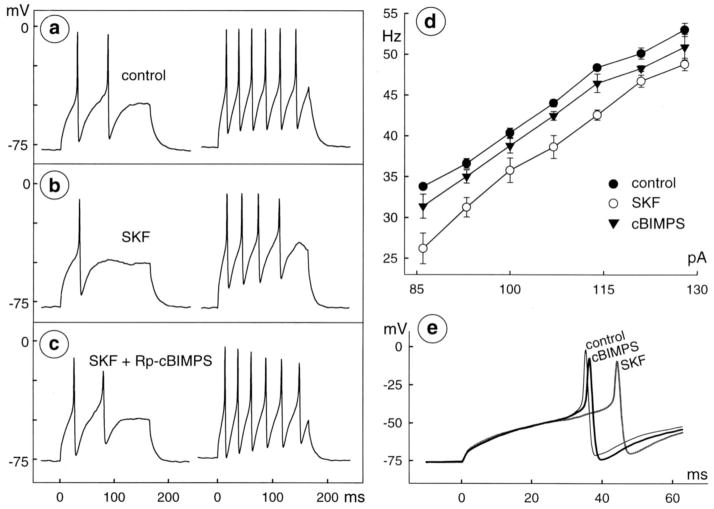
Fig 8.
Reversal of D1 agonist response by protein kinase A inhibitor. Spikes were recorded from a single cell before (a) and during (b) application of 30 μM SKF-38393, and during ( c) subsequent application of a mixture of 30 μM SKF-38393 plus 100 μM Rp-5,6-DCl-cBIMPS. Stimuli are 165 msec, constant-current injections of 72 and 107 pA in left and right, respectively, of a–c. Membrane potential is −78 mV at beginning of left trace in a and b and −77 mV in c. d, Intensity-frequency plot with open and filled circles used as in Figures 5–7 and filled triangles plotting data collected during application of SKF-38393 plus Rp-5,6-DCl-cBIMPS. e, Latency of first spikes elicited by injection of 65 pA in control (thin, black trace), 30 μM SKF-38393 (SKF; thick, dark gray trace), and mixture of 30 μM SKF-38393 plus 100 μM Rp-5,6-DClcBIMPS (cBIMPS; thick, black trace). Records are from same cell as in a–d, superimposed at fast sweep speed. Data were formatted as in Figure 5.

