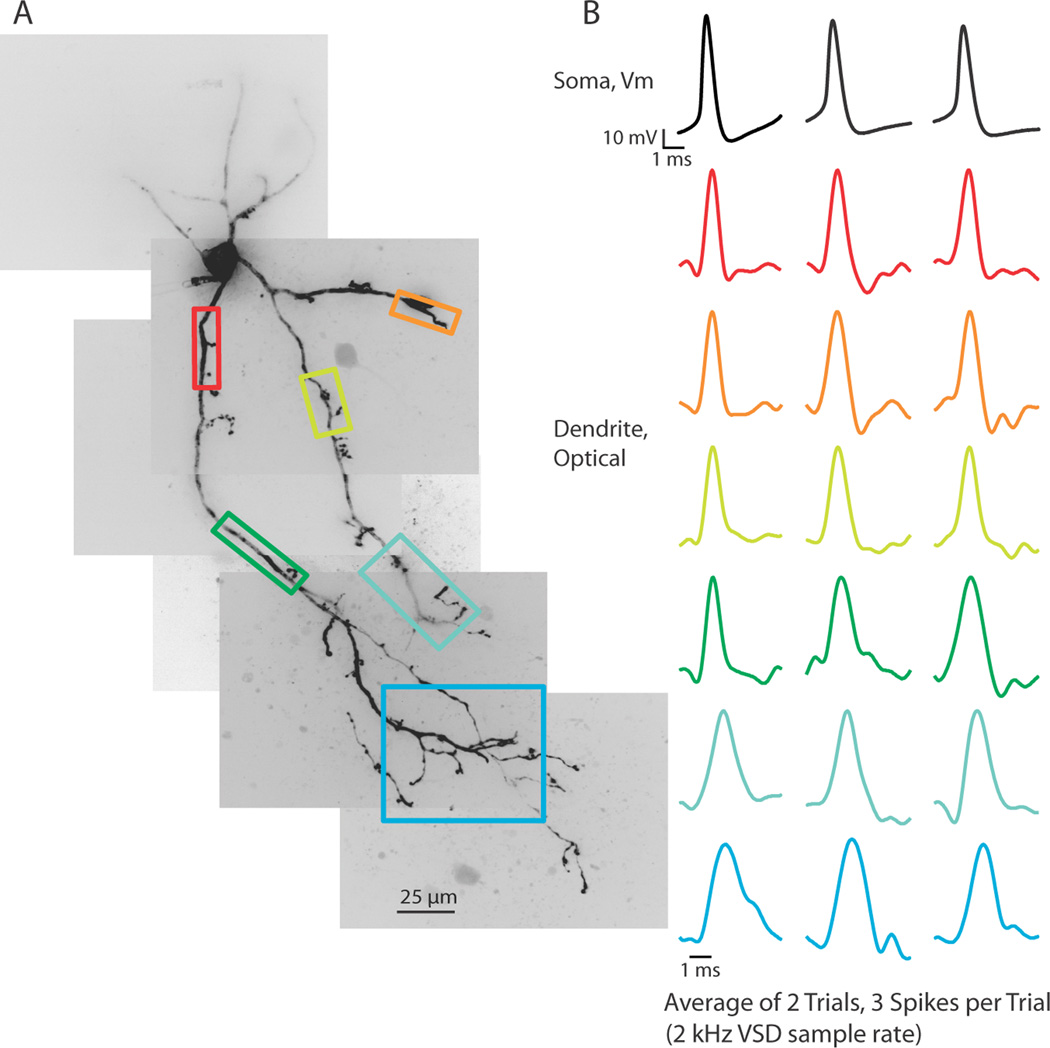
Figure 1.
Action potentials propagate throughout the dendritic arbor. (A) Voltage-sensitive dye fluorescence confocal z-projection of an LGNd interneuron. Colored boxes are regions of interest for optical recordings in (B). (B) Electrical and optical signals corresponding to 3 action potentials in a train initiated by a depolarizing step at the soma. Electrical and optical signals are an average of 2 trials. Black traces are somatic electrode recordings. Colored traces are optical signals (ΔF/F) acquired at 2 kHz in the dendrite. Colored traces correspond to colored boxed regions in (A). Optical traces are normalized to peak amplitude.

