Figure 9.
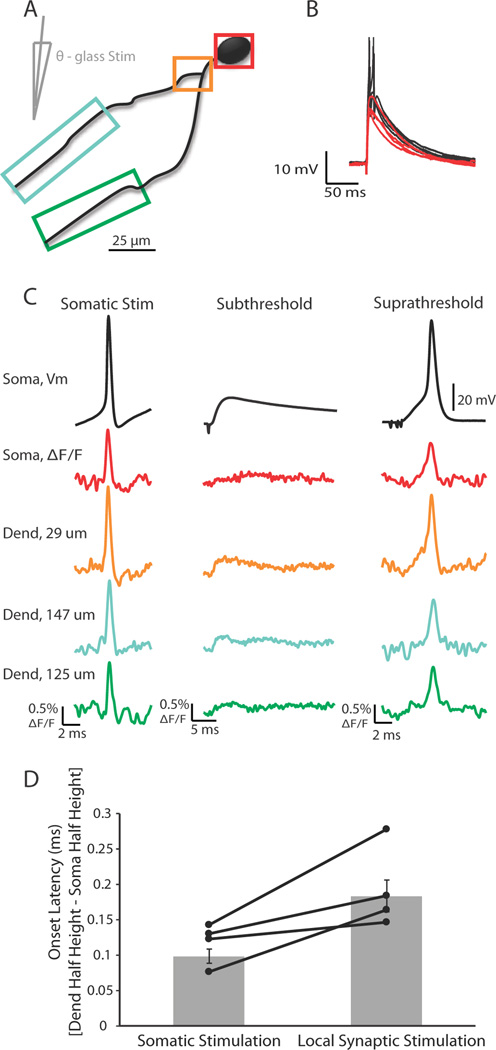
Action potentials elicited by either somatic current injection or local synaptic stimulation appeared first in or near the soma. (A) Illustration of a voltage-sensitive dye filled cell and theta-glass stimulator. Colored boxes correspond to somatic and dendritic regions of interest during imaging. (B) Overlay of subthreshold (red) and suprathreshold (black) electrical signals recorded at the soma in response to local synaptic stimulation. Action potentials are truncated for clarity. (C) Electrical and optical signals corresponding to action potentials elicited by somatic current injection (average of 2 trials), local synaptic stimulation resulting in subthreshold events (average of 10 trials), or local synaptic stimulation that elicited action potentials (average of 3 trials). Owing to variations in performance of the dye, differences in ΔF/F between locations is not necessarily indicative of differences in actual voltage. (D) Onset latency of action potentials elicited by either somatic current injection or local synaptic stimulation. Onset latency is defined as the difference between the time of action potential half-height at the dendrite and soma. This difference was calculated for action potentials at the soma and the dendrite where EPSPs occurred first. Connected points correspond to a single cell in which action potentials were evoked somatically or synaptically (n = 5 cells). Gray bars are average onset latency ± SEM. Note that propagation speed decreased for action potentials elicited by local synaptic stimulation (p < 0.05).

